Figure 3. EpCAM aptamer binding on cell lines. Fluorescently labeled EpCAM aptamers were incubated with RB cell lines and Müller glial
cells and analyzed with flow cytometry. Histogram overlay plot showing distinct population of (A) WERI-Rb1 and (B) Y79 cells bound to EpDT3-FI compared to unstained and Scr-EpDT3-FI bound cells. C: Histogram overlay plot of Müller glial cells showing no distinct population upon incubation with EpDT3-FI or Scr-EpDT3-FI
from unstained cells.
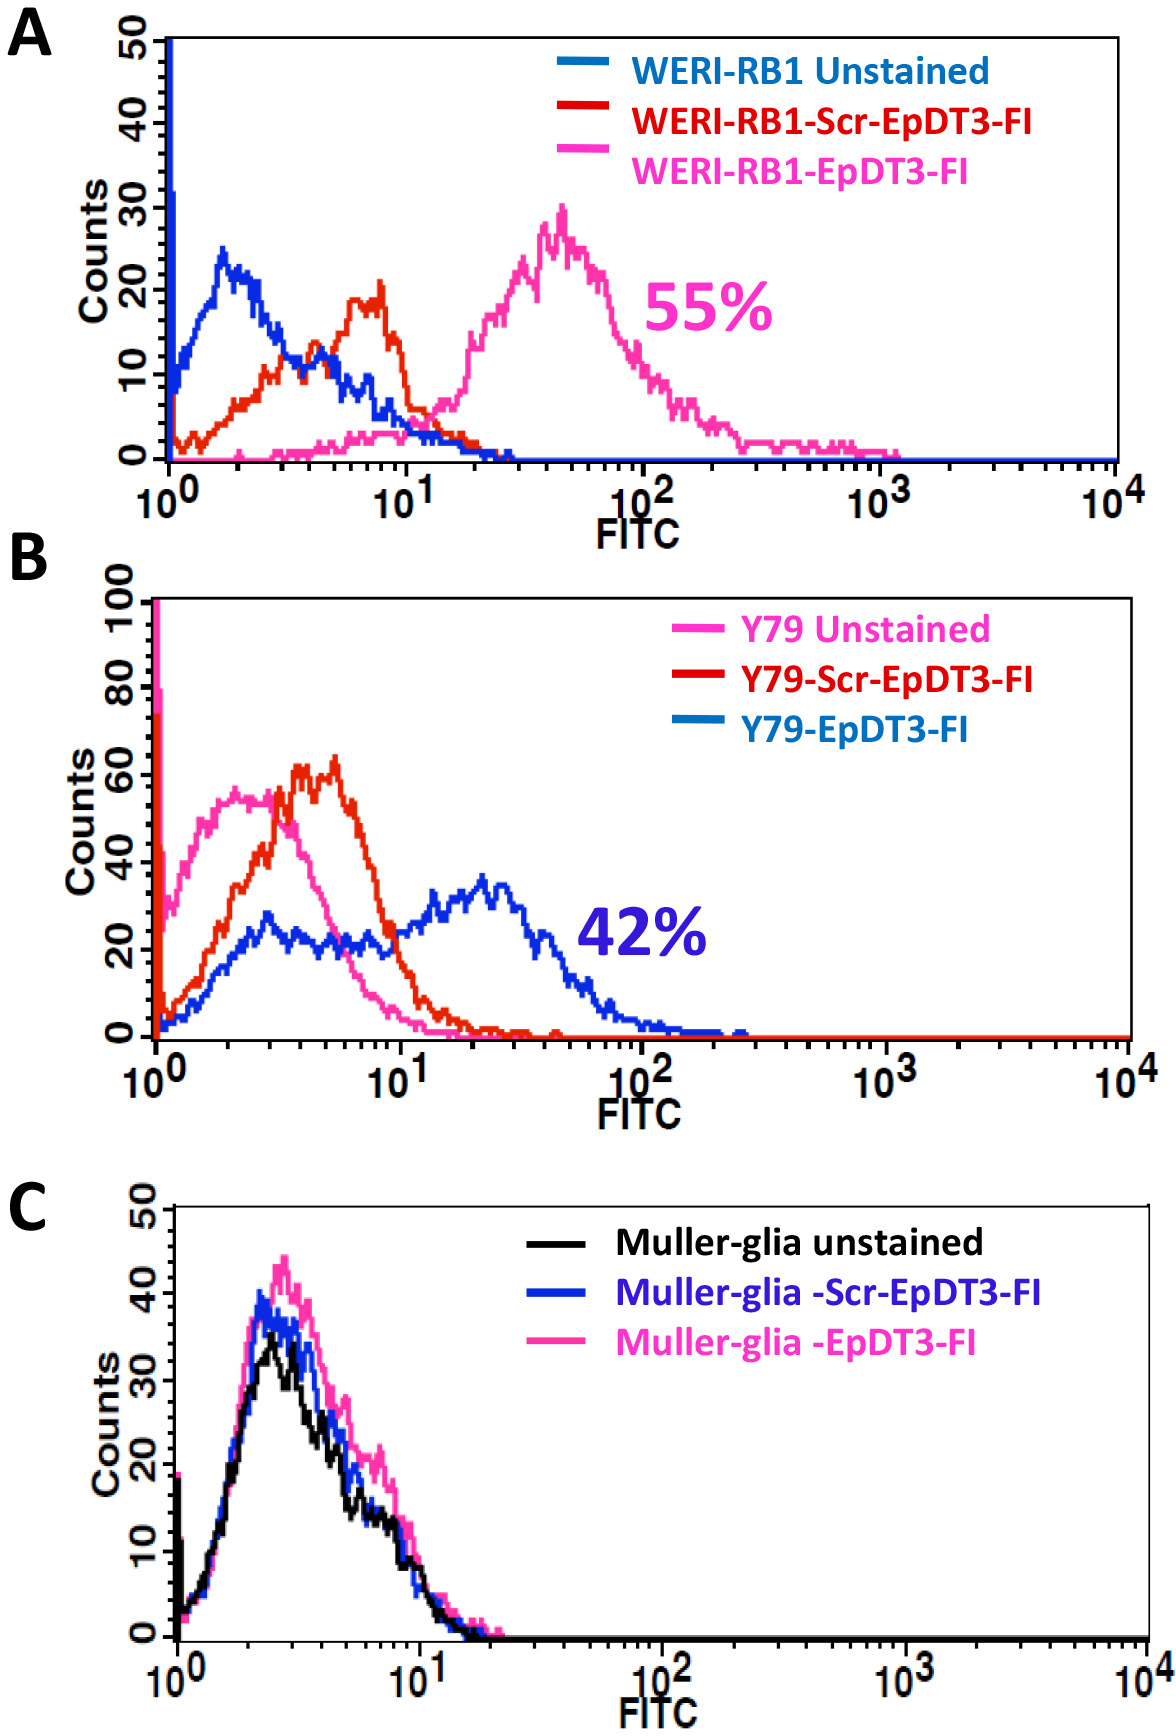
 Figure 3 of
Subramanian, Mol Vis 2012; 18:2783-2795.
Figure 3 of
Subramanian, Mol Vis 2012; 18:2783-2795.