Figure 2. Diagram summarizing the literature reporting on the distribution of tau in the retina of normal and pathological states. The
background is a cross section showing the layered structure of the human retina. Ovals labeled Tau represent expression of
total tau. Parallelograms labeled Tau represent tau aggregates. Triangles labeled pTau represent expression of abnormal phosphorylated
tau. A: The distribution of tau in the normal aged retina is illustrated. B: The distribution of tau in the glaucomatous retina is illustrated. C: The distribution of tau in the retina in age-related macular degeneration (AMD) is illustrated. Abbreviations: nerve fiber
layer (NFL), ganglion cell layer (GCL), inner plexiform layer (IPL), inner nuclear layer (INL), outer plexiform layer (OPL),
outer nuclear layer (ONL), retinal pigment epithelium (RPE).
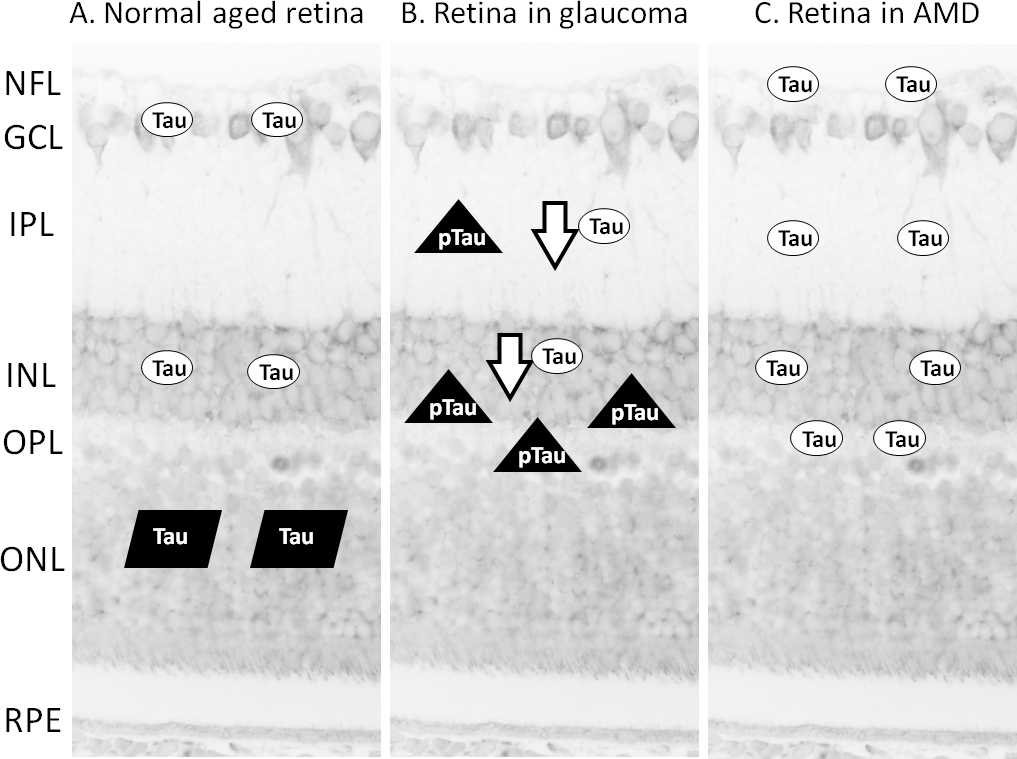
 Figure 2 of
Ho, Mol Vis 2012; 18:2700-2710.
Figure 2 of
Ho, Mol Vis 2012; 18:2700-2710.