Figure 9. Green fluorescent protein (GFP)-expression in transplanted cells after intravitreal injection. Retinal section (A) and inside image (B) at two to threeweeks after transplantation. Slides were counterstained with DAPI (blue in panel A). Arrows and arrowheads indicate transplanted cells (green). ONL, outer nuclear layer; INL, inner nuclear layer; GCL, ganglion
cell layer; ONH, optic nerve head. Scale bars: 100 μm.
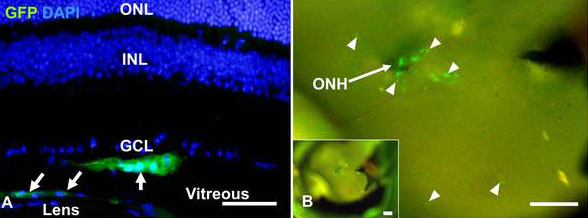
 Figure 9 of
Cho, Mol Vis 2012; 18:2658-2672.
Figure 9 of
Cho, Mol Vis 2012; 18:2658-2672.