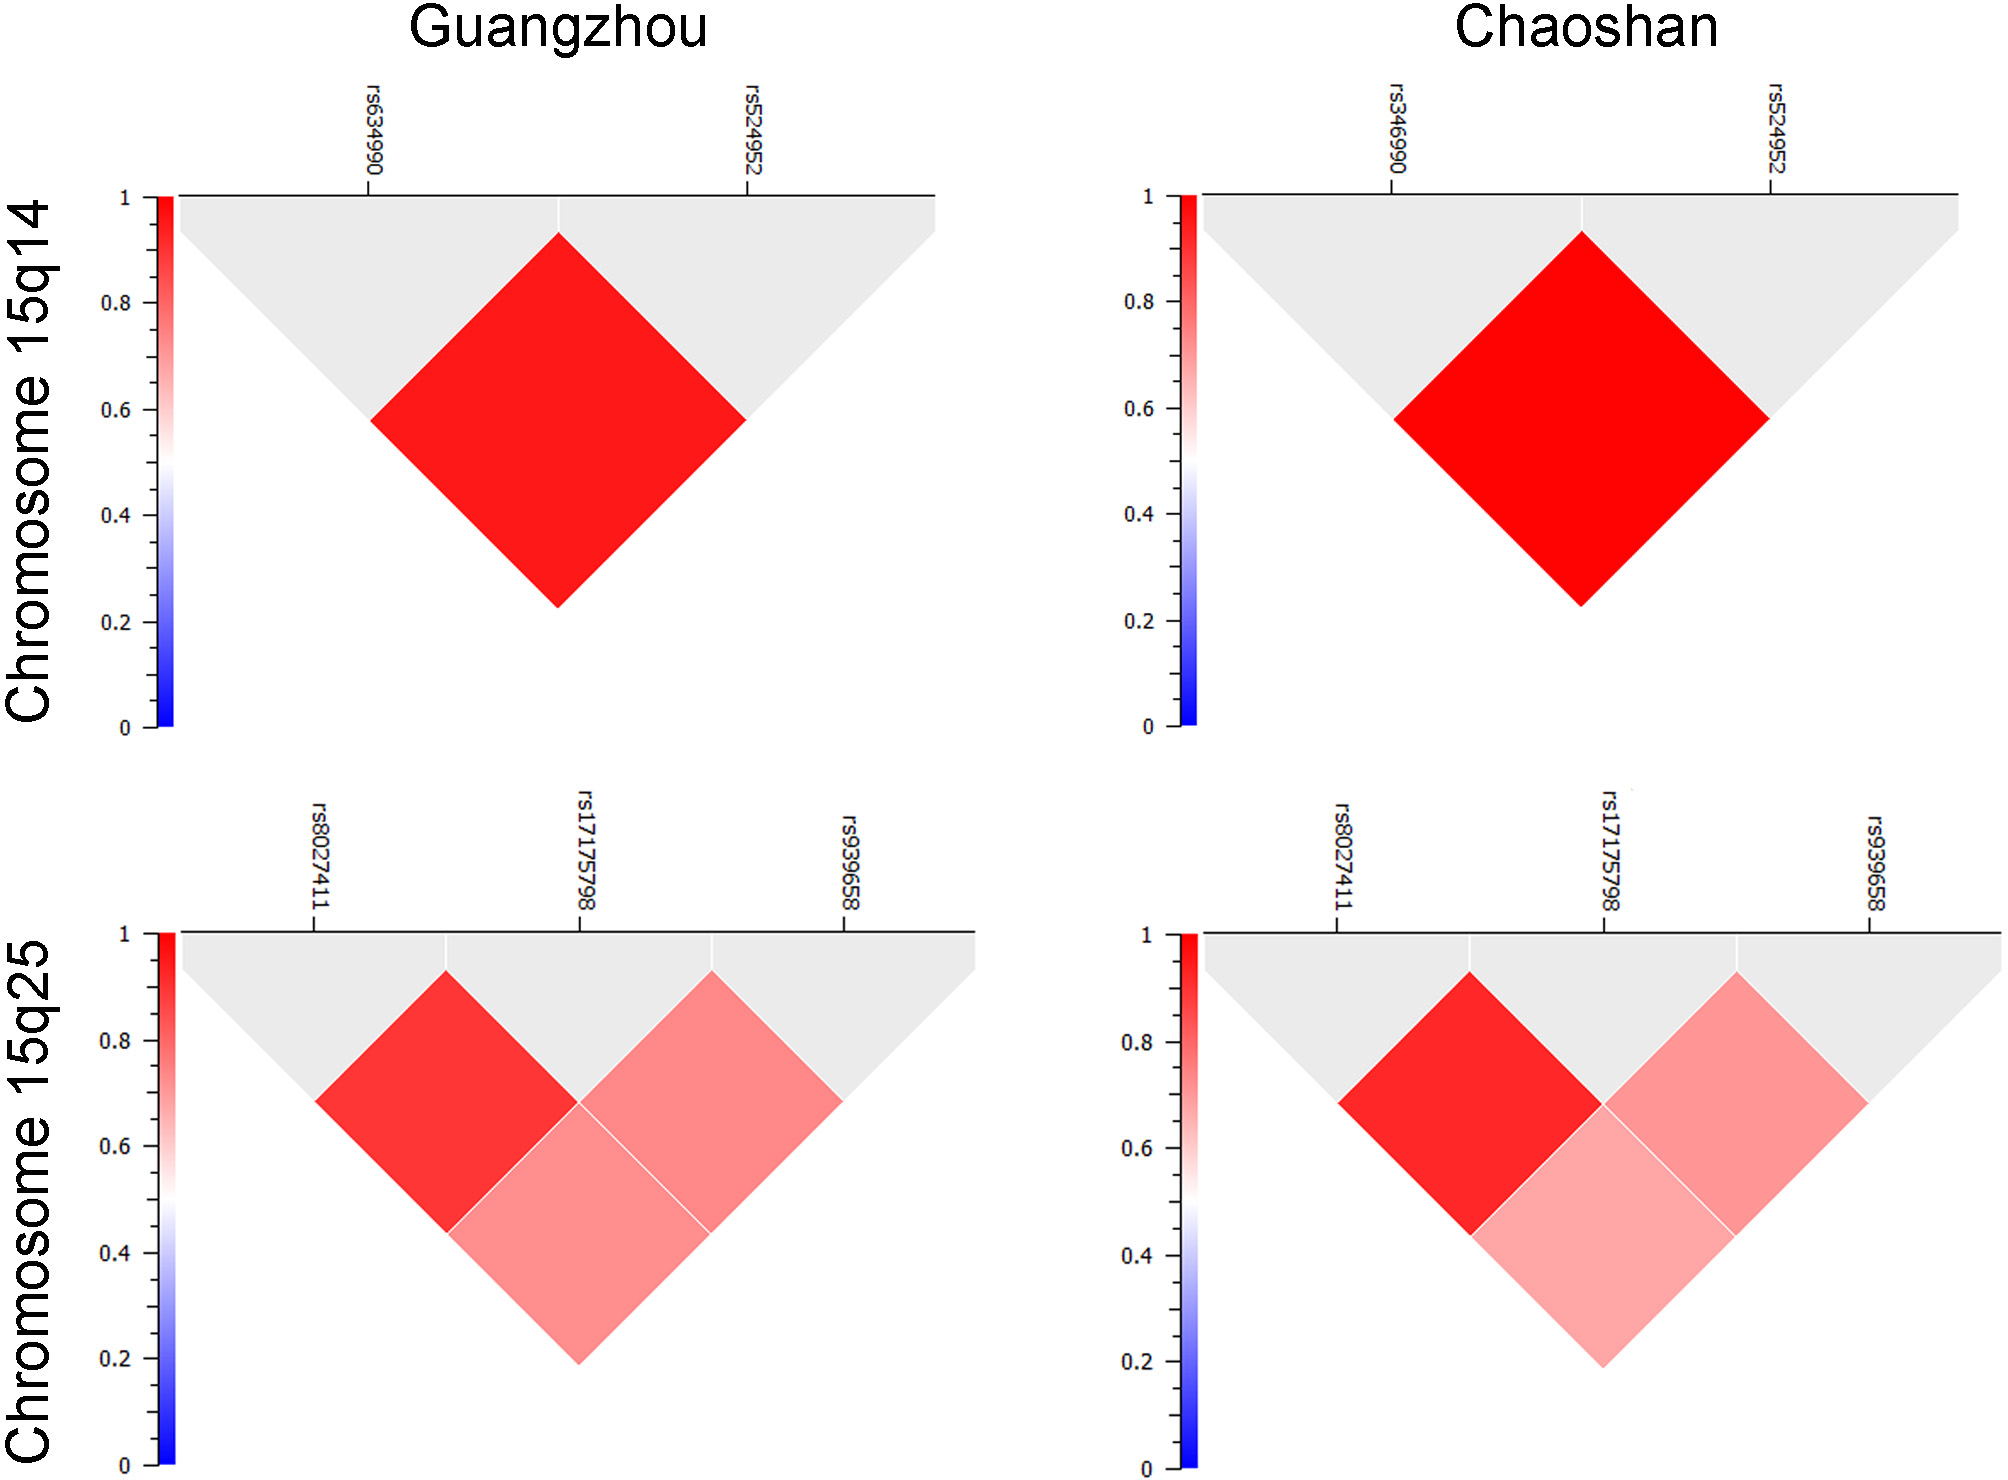
Figure 2. Linkage disequilibrium of markers at chromosome 15q14 and chromosome 15q25 in the Guangzhou and Chaoshan populations. Linkage
disequilibrium is shown as r
2. The chromosomal positions are
rs634990 (35,006,073),
rs524952 (35,005,886),
rs8027411 (79,461,029),
rs17175798 (79,463,960), and
rs939658 (79,451,869) from GRCh37.p5, build 37.3. For reference, the 5′ end of RASGRF1 is at 79,383,215, the 5′ end of
GOLGA8B is at 34,875,771, the 3′ end of
ACTC1 is at 35,080,297, and the 3′ end of
GJD2 is at 35,044,679; the loci are not included in the regions shown here.
 Figure 2 of
Jiao, Mol Vis 2012; 18:2633-2646.
Figure 2 of
Jiao, Mol Vis 2012; 18:2633-2646.