Figure 1. Distribution of refraction and axial length among high myopic and control individuals in the Guangzhou and Chaoshan myopia
and unaffected groups. The spherical equivalent of each individual is shown on the abscissa while the axial length is shown
on the ordinate axis. Although the control samples are similarly clustered around 0 D: and 23 mm, the Chaoshan myopic group includes individuals with spherical equivalents < −4.
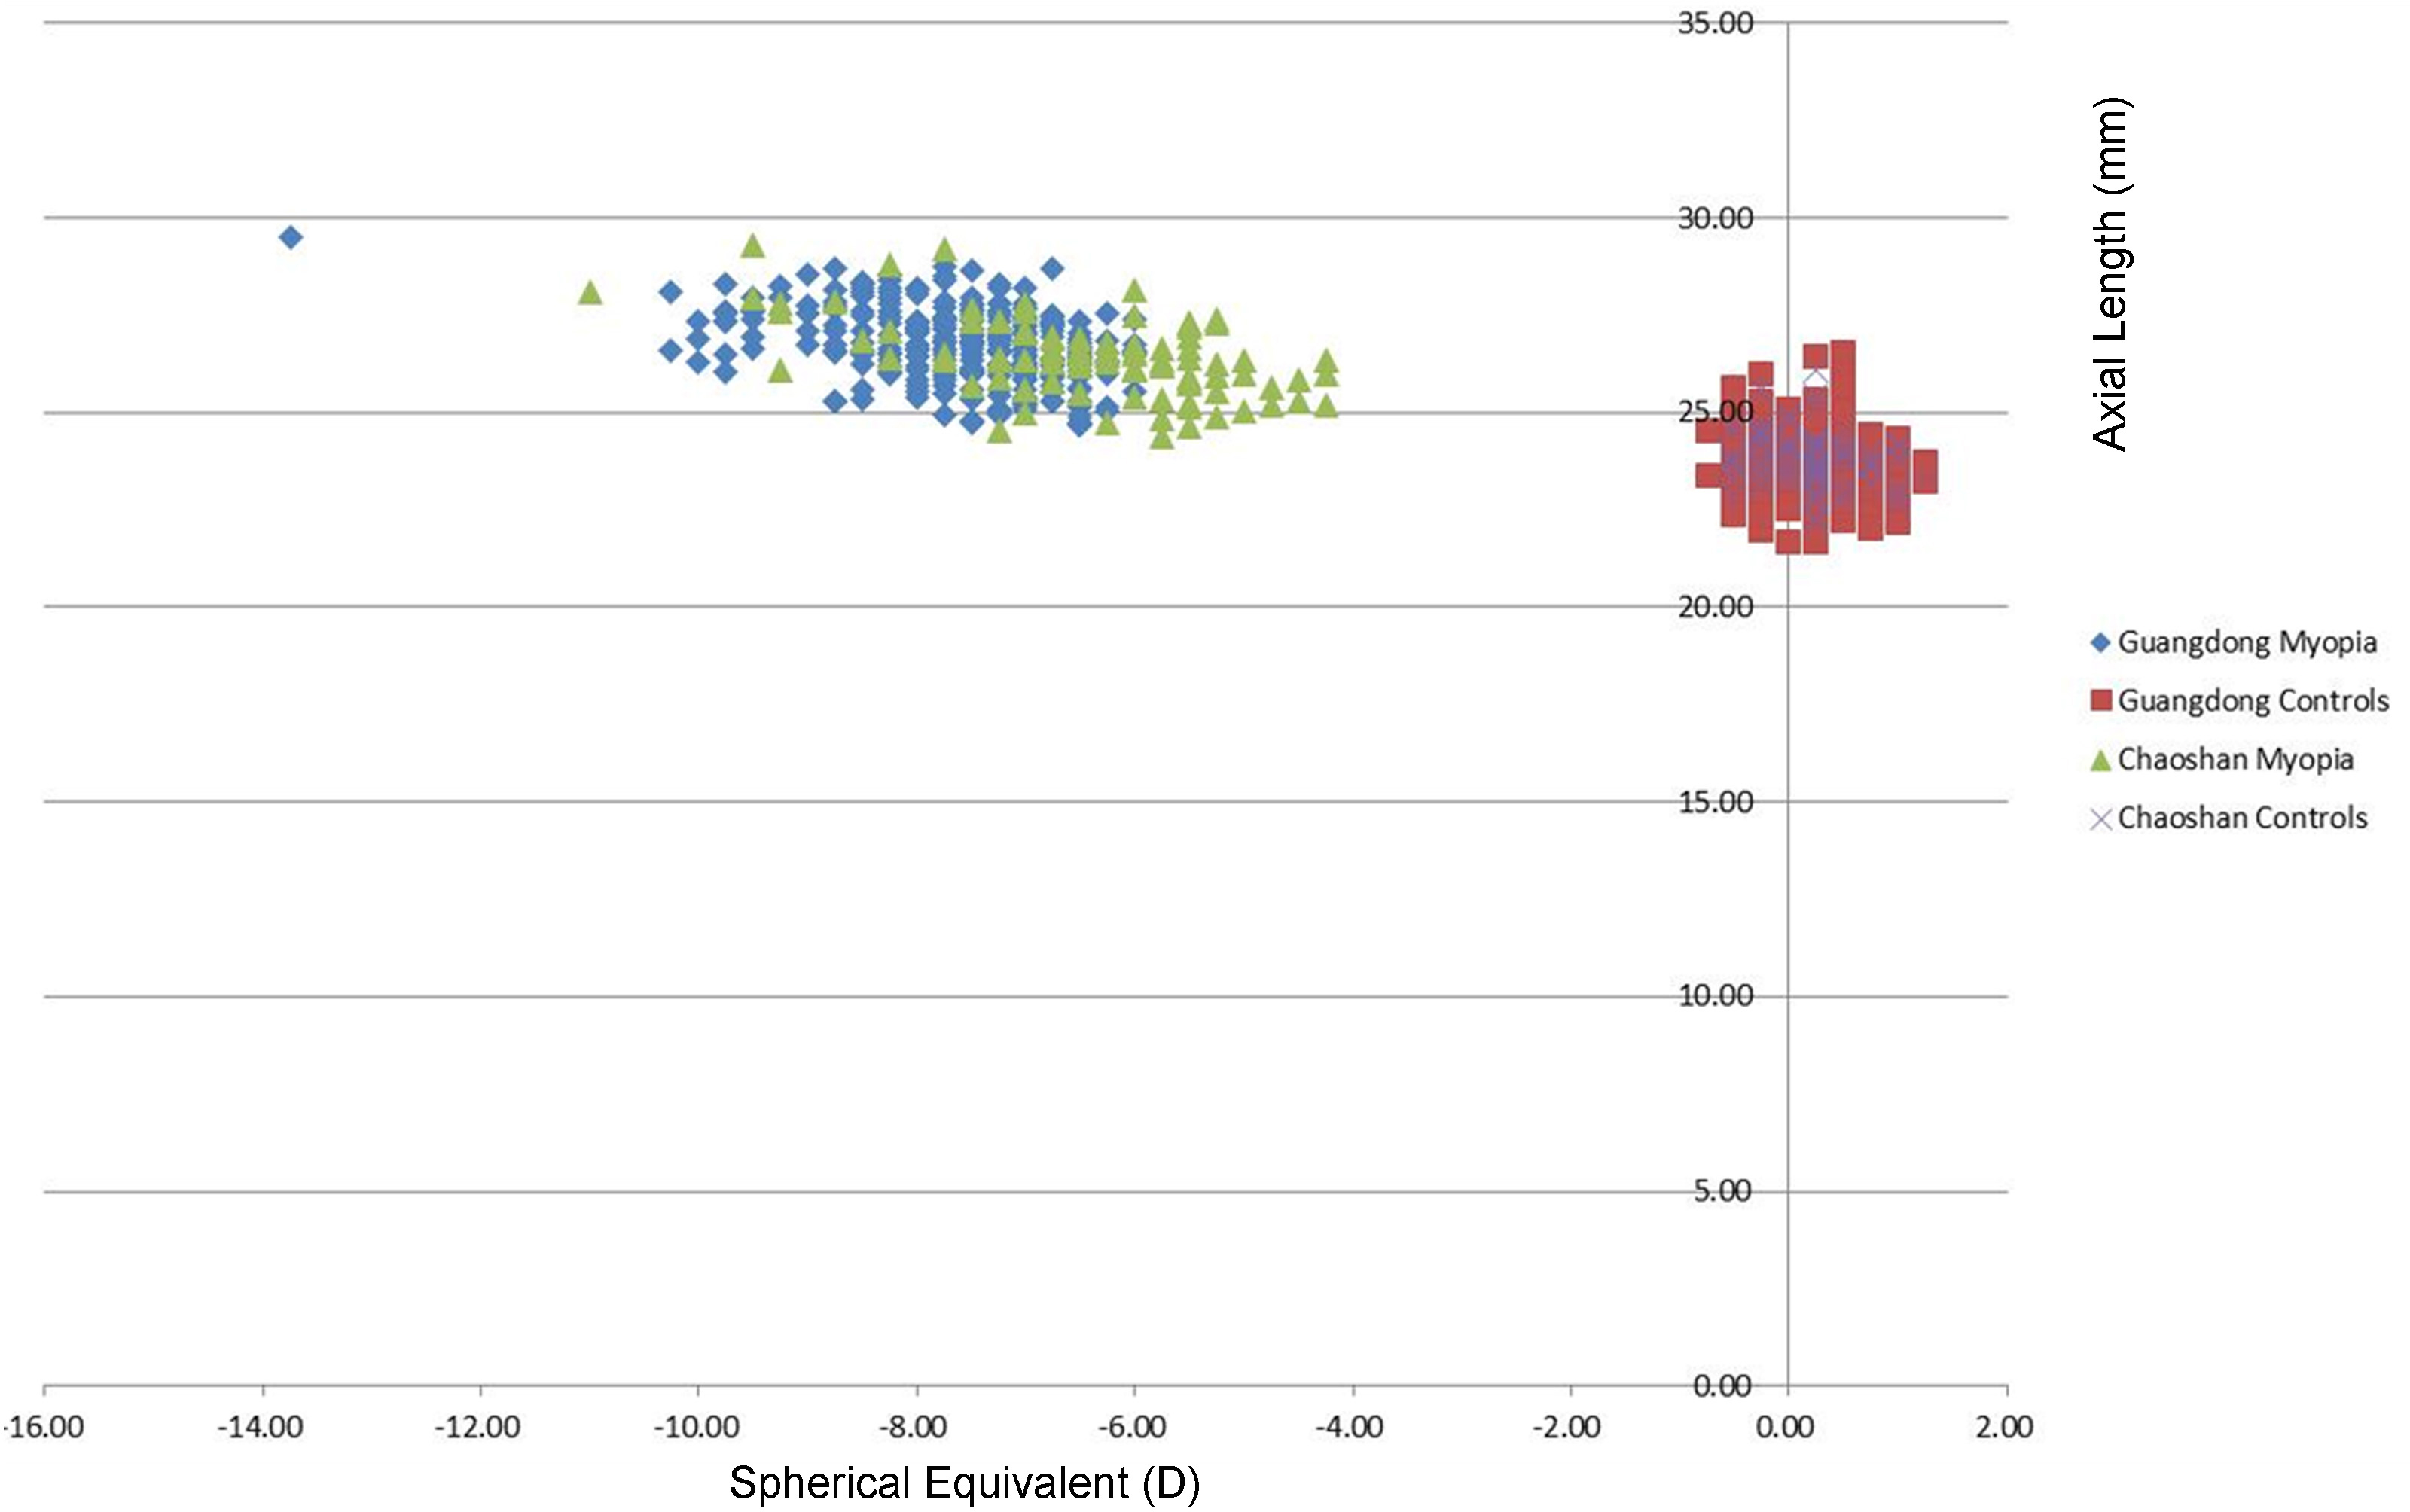
 Figure 1 of
Jiao, Mol Vis 2012; 18:2633-2646.
Figure 1 of
Jiao, Mol Vis 2012; 18:2633-2646.