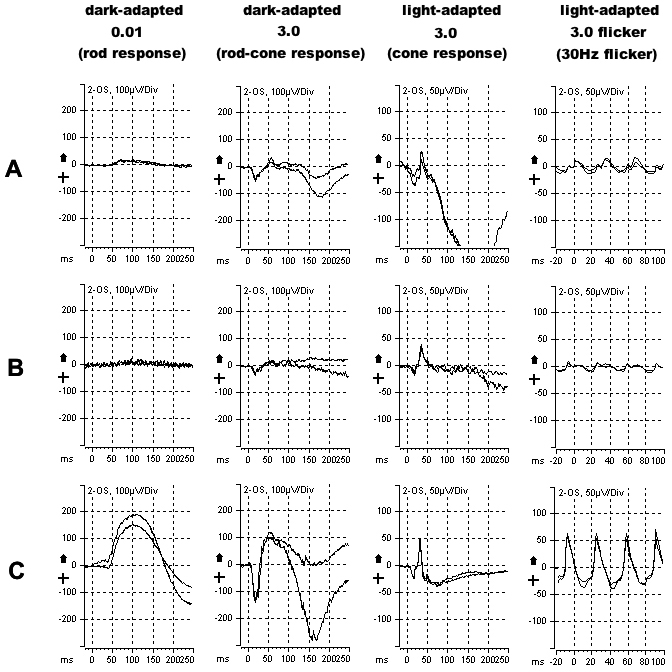
Figure 4. Electroretinograms of the patient at baseline
A: and after 30 months
B: compared to a normal control
C: showing severely reduced scotopic and photopic responses, with evidence of progression over the follow-up period, in keeping
with the diffuse rod-cone photoreceptor degeneration. The four columns represent different categories of electroretinogram
(ERG) response, labeled according to the names suggested by the ISCEV standard [
7]. Each graph shows two repetitions of the same response, all recorded from the left eye.
 Figure 4 of
Neri, Mol Vis 2012; 18:2623-2632.
Figure 4 of
Neri, Mol Vis 2012; 18:2623-2632.