Figure 3. Fundus pictures obtained at presentation with a scanning laser ophthalmoscope. A: 55° infrared (IR) image centered at the posterior pole. B: 20° retinal auto-fluorescence (AF) imaging of the optic nerve head (OHN), showing some small hyper-auto-fluorescent spots
corresponding to ONH drusen. C: 55° red-free (RF) image: the areas of retinal pigmented epithelium (RPE) mottled atrophy appear as brighter spots. D: 55° AF image: the same RPE atrophic spots shown in C: appear darker in AF imaging.
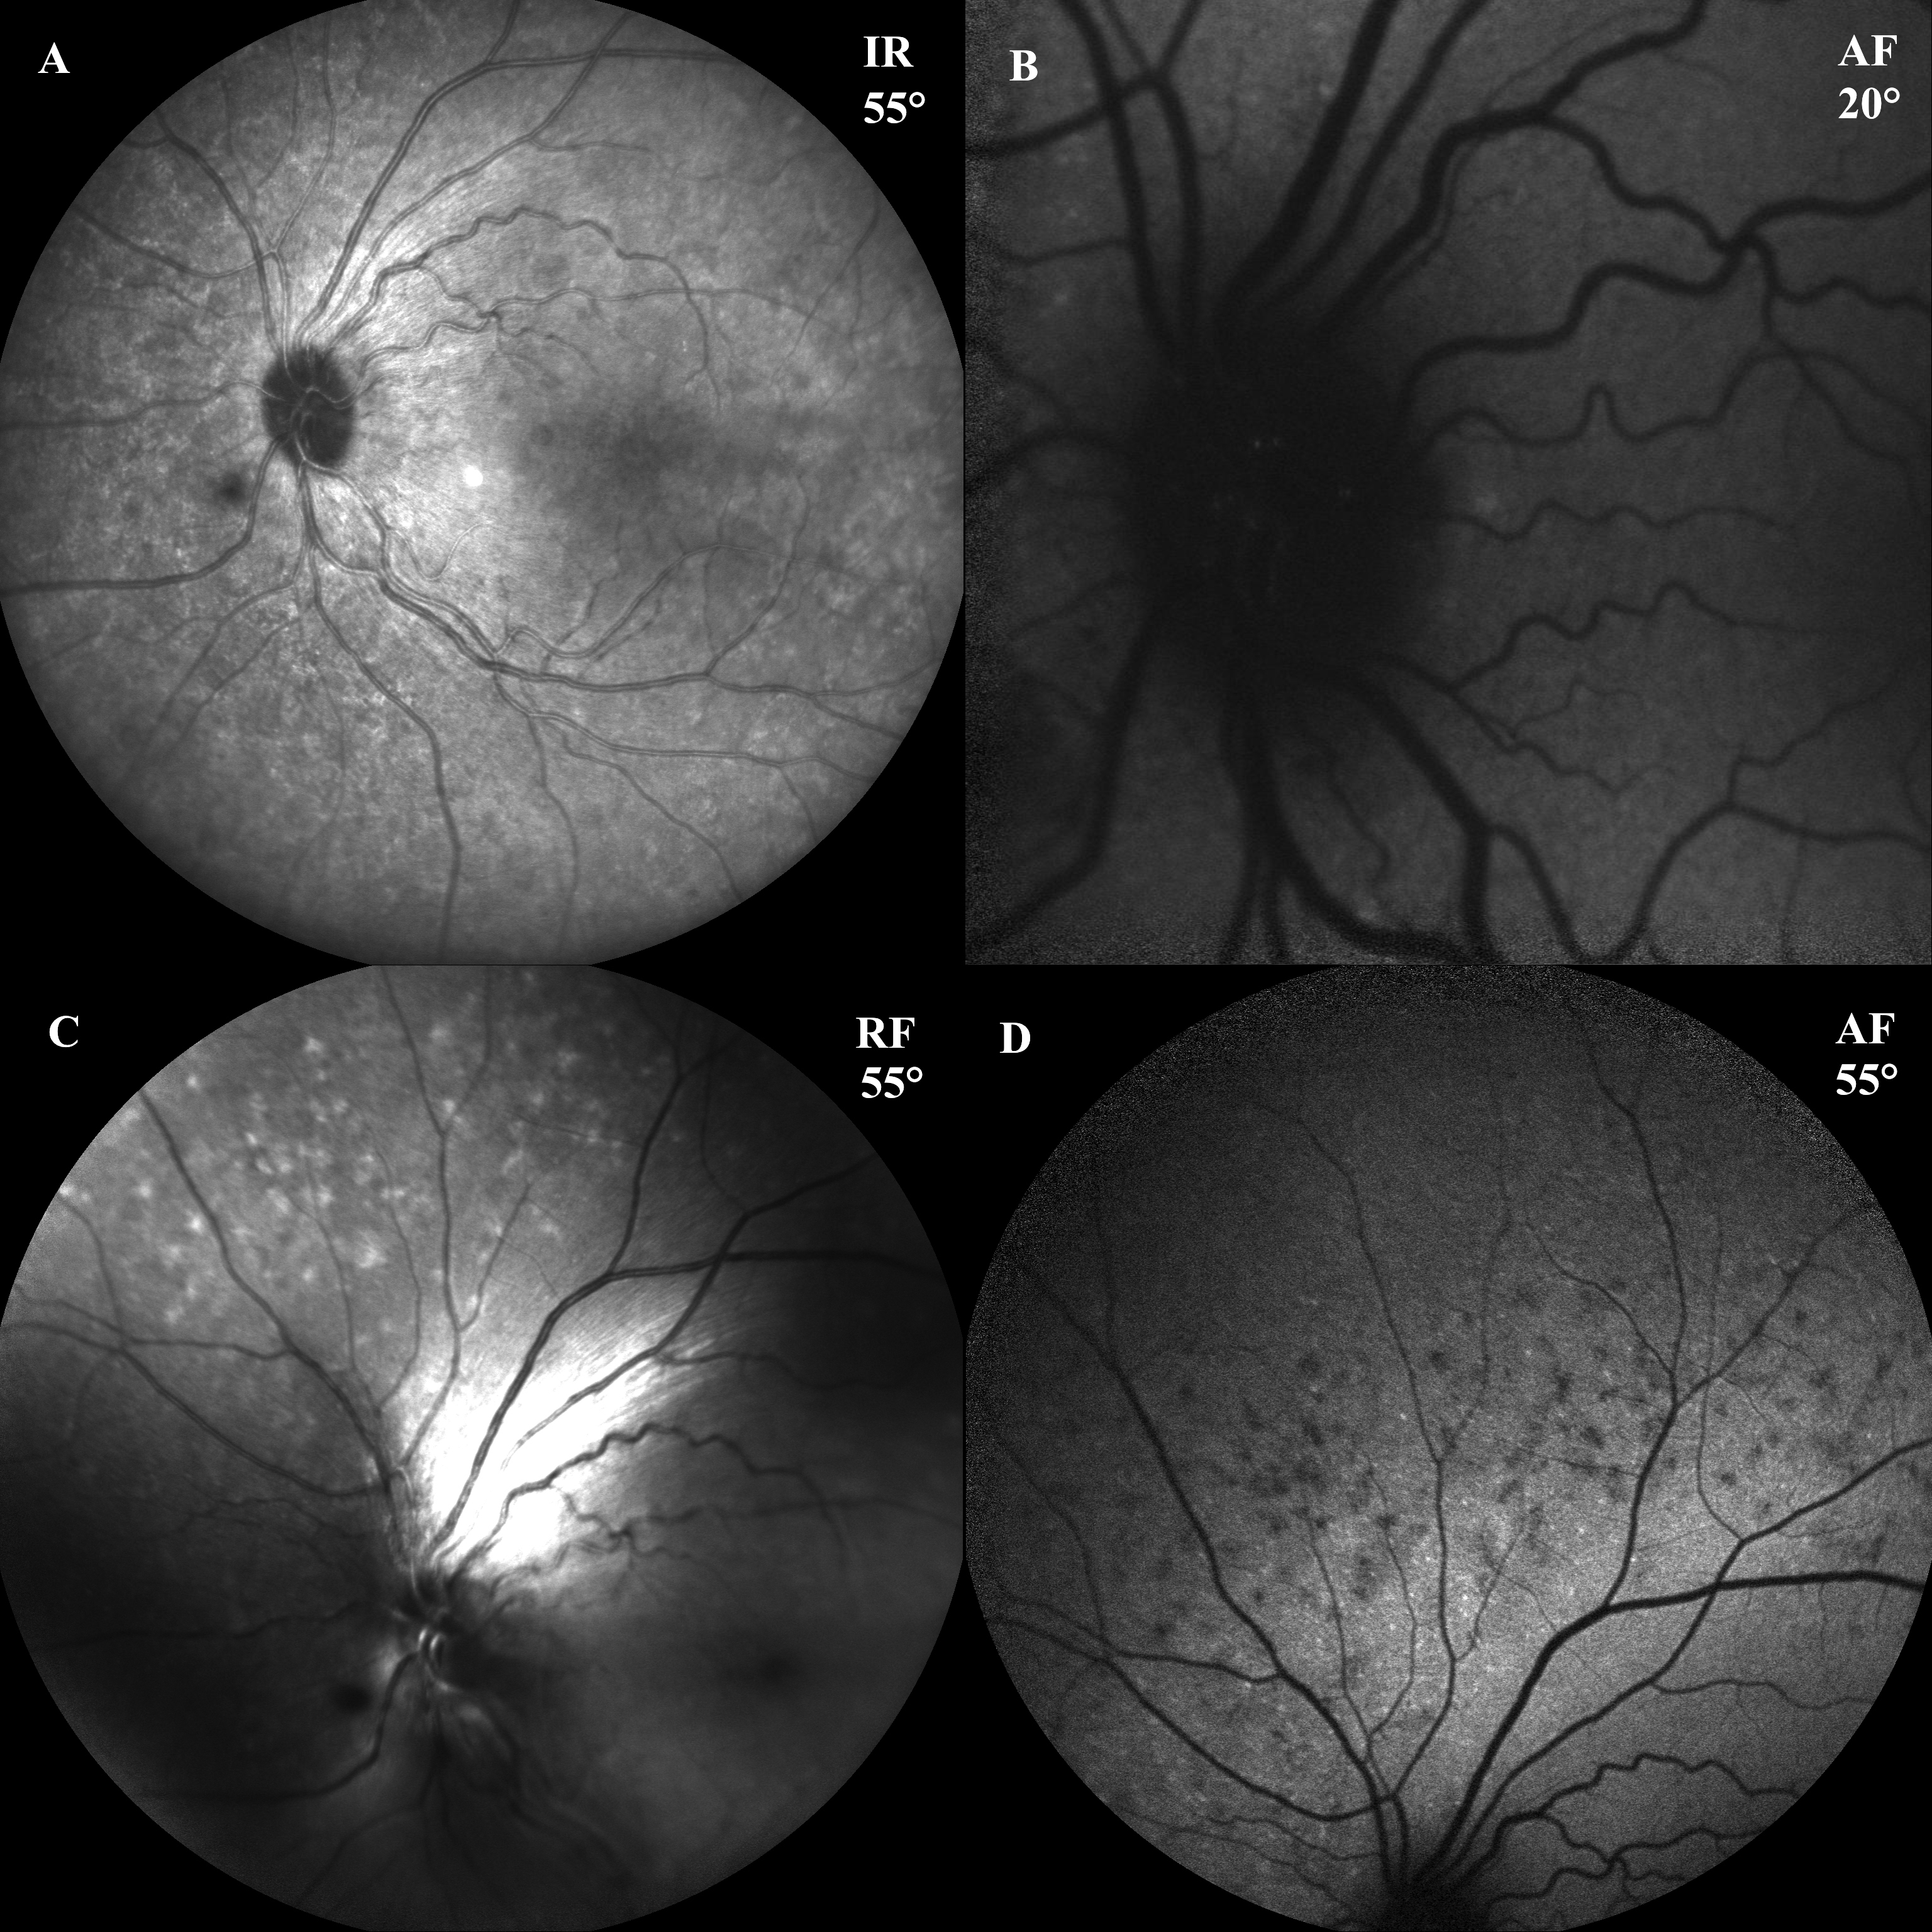
 Figure 3 of
Neri, Mol Vis 2012; 18:2623-2632.
Figure 3 of
Neri, Mol Vis 2012; 18:2623-2632.