Figure 2. Retinography and optical coherence tomography imaging taken at presentation (right eye on the left panel). No significant
morphological modifications were detected at the 30-month follow-up examination. A: Color pictures of the patient's fundus show small optic discs and retinal pigmented epithelium mottling and atrophy, appearing
as pale yellowish-white retinal spots similar to flecks. There are a few bone spicule-like deposits at the temporal periphery
(arrows). Square insets highlight the macula, which is shown enlarged in the lower panel I: B: Color pictures of the patient's macula I: vertical and horizontal optical coherence tomography (OCT) scans of the retina passing at the fovea (II, III), and Early
Treatment Diabetic Retinopathy Study (ETDRS) maps of macular thickness measured with spectral domain OCT (IV). Multiple cystic
spaces in the retinal inner layers are present at the fovea, with increased foveal thickness in both eyes.
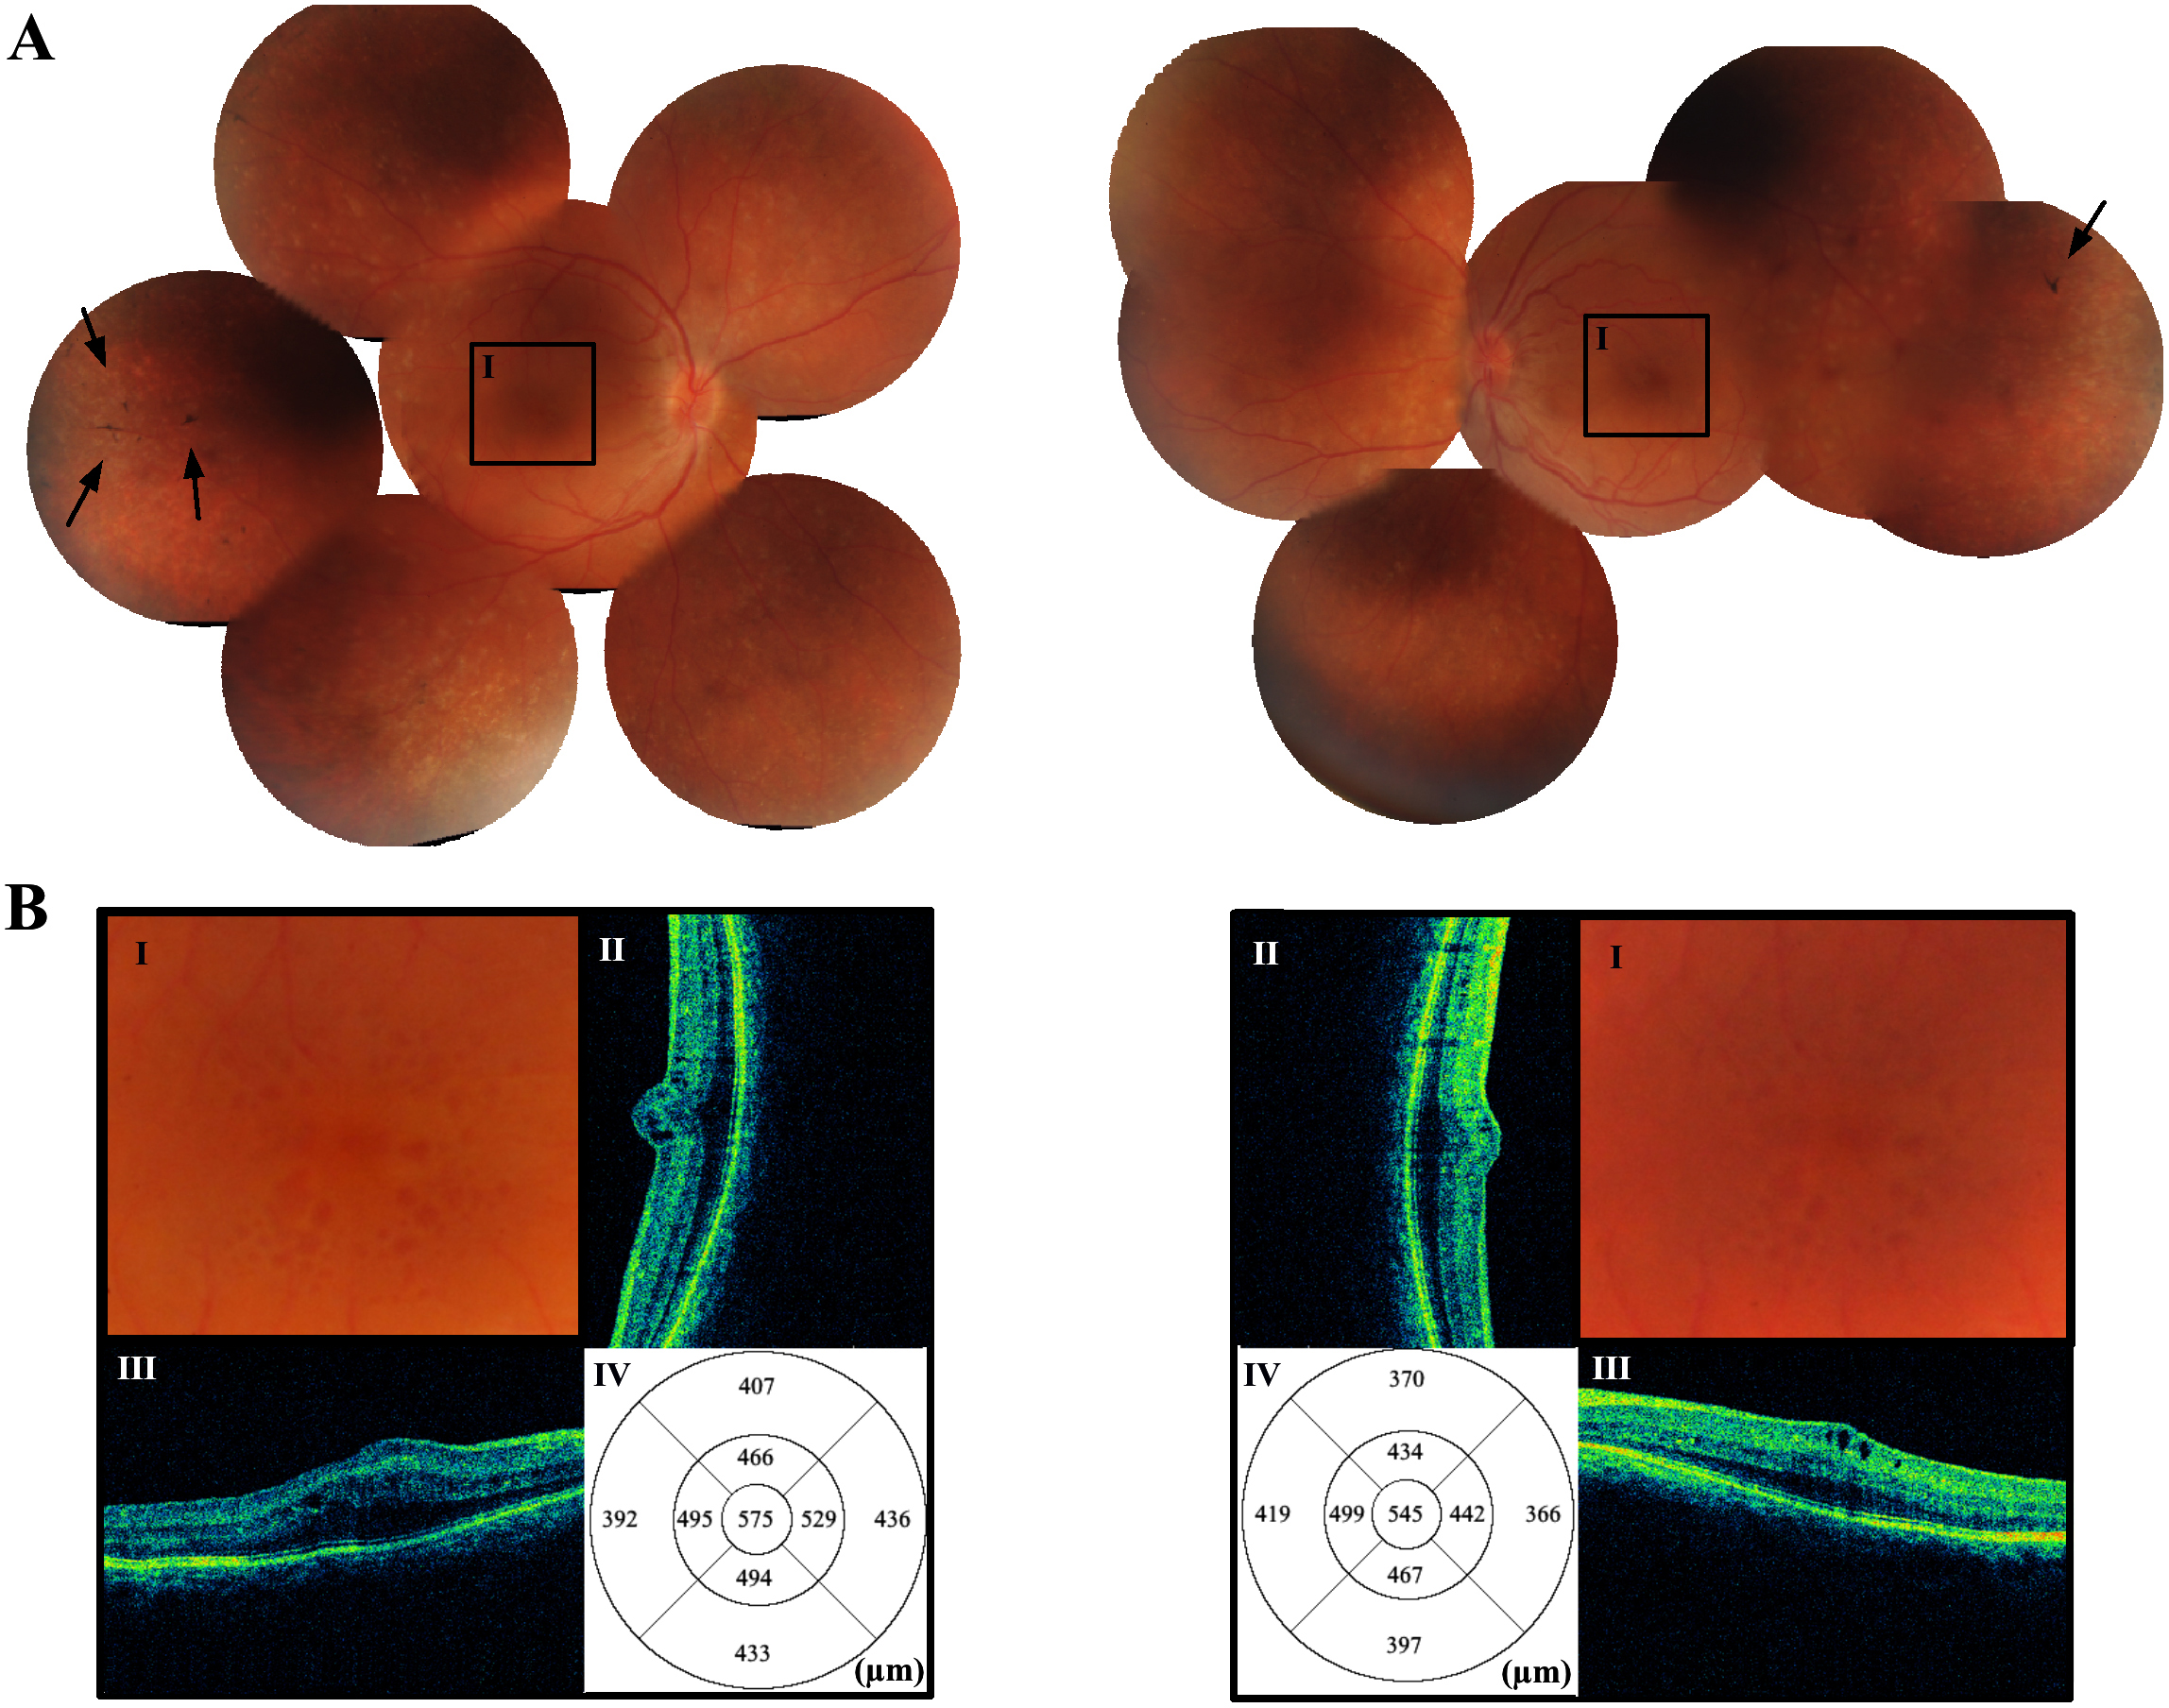
 Figure 2 of
Neri, Mol Vis 2012; 18:2623-2632.
Figure 2 of
Neri, Mol Vis 2012; 18:2623-2632.