Figure 3. Western blot of T-cell
cytokine receptor (TCCR). A: Twenty-one aqueous humor
samples of the control and the age-related macular degeneration
(AMD) patient groups were assessed with western blot using a
specific antibody against TCCR. Upper numbers indicate the value
by densitometry. B: The western blot data were
quantified with a densitometer (** p=0.0013). The y-axis
represents arbitrary scanning units.
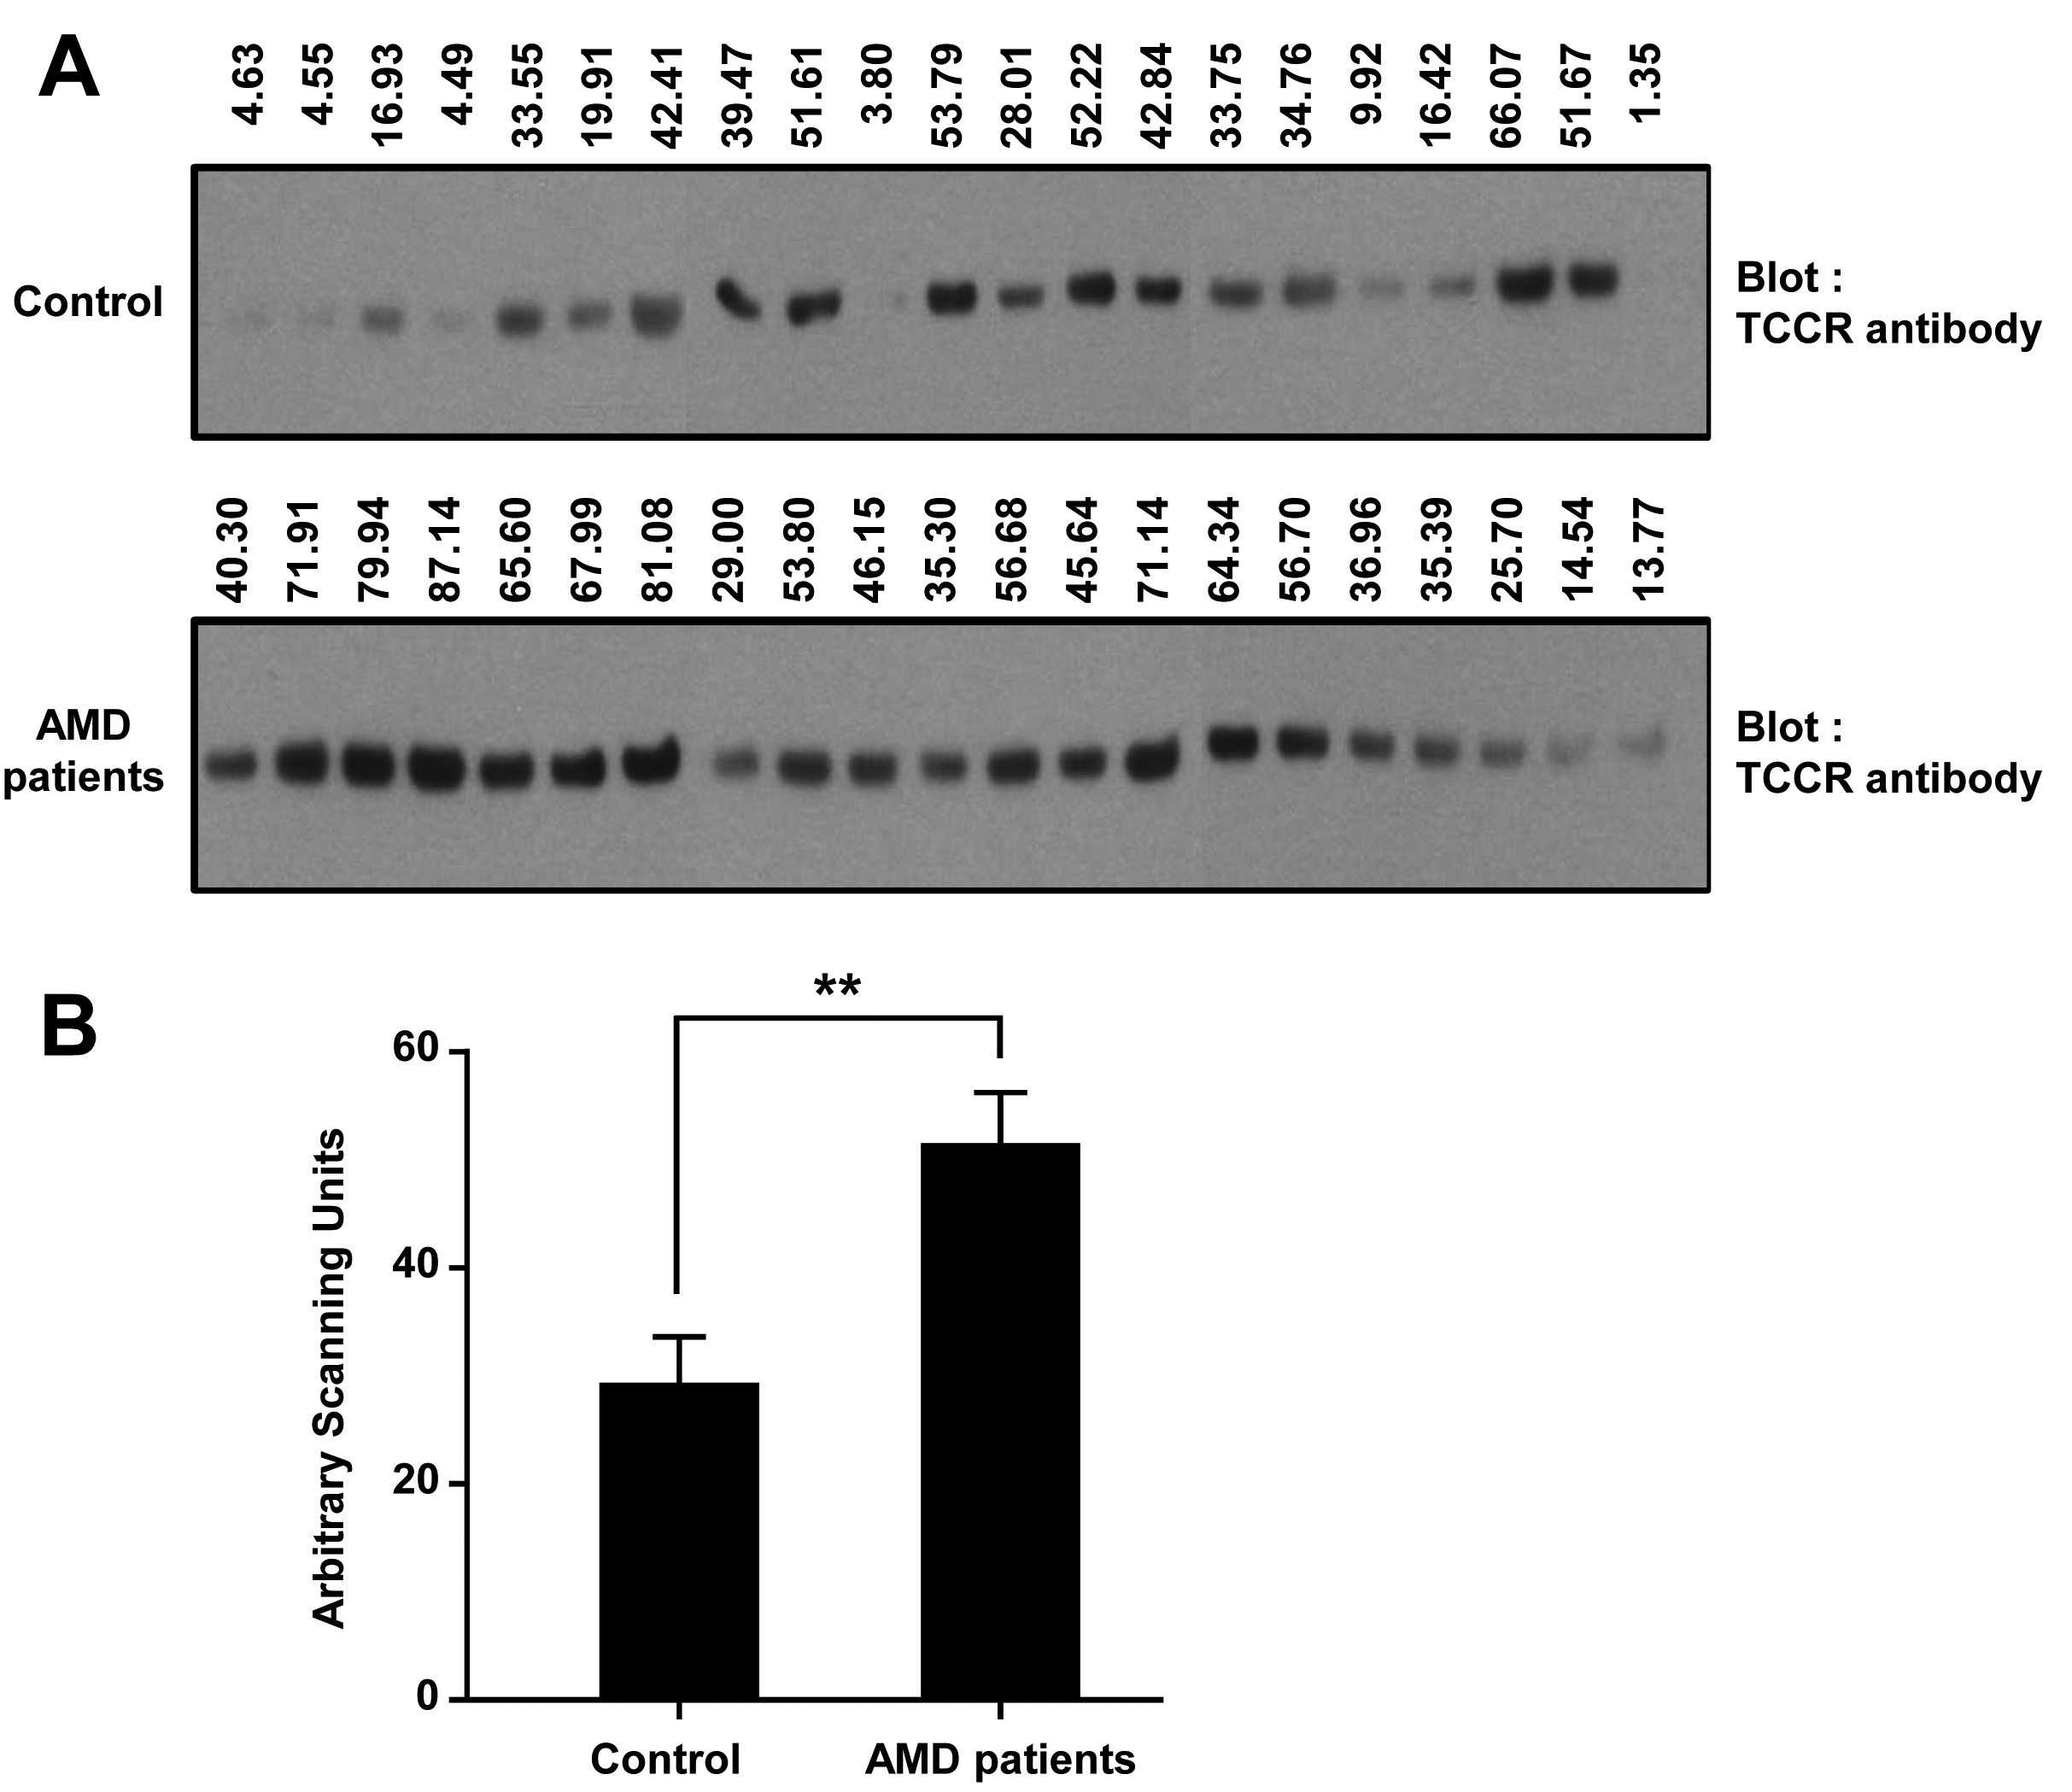
 Figure 3
of Sung, Mol Vis 2012; 18:234-240.
Figure 3
of Sung, Mol Vis 2012; 18:234-240.