Figure 2. Effect of IMD-0354 on cellular infiltration A: and protein concentration B: in aqueous humor collected 24 h after lipopolysaccharide (LPS) treatment. Data are shown as mean±standard error of mean
(SEM; n=8). *p<0.05, **p<0.01, significantly different from the LPS group.
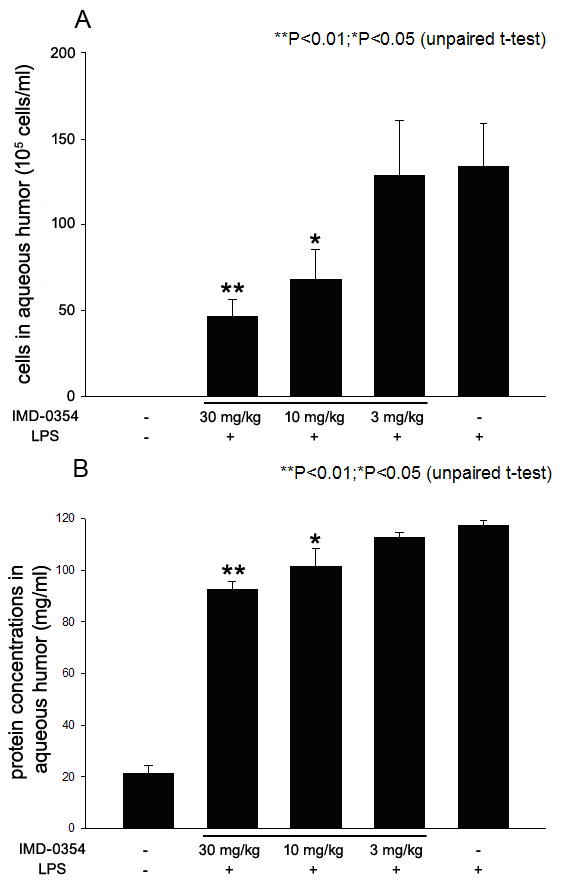
 Figure 2 of
Lennikov, Mol Vis 2012; 18:2586-2597.
Figure 2 of
Lennikov, Mol Vis 2012; 18:2586-2597.