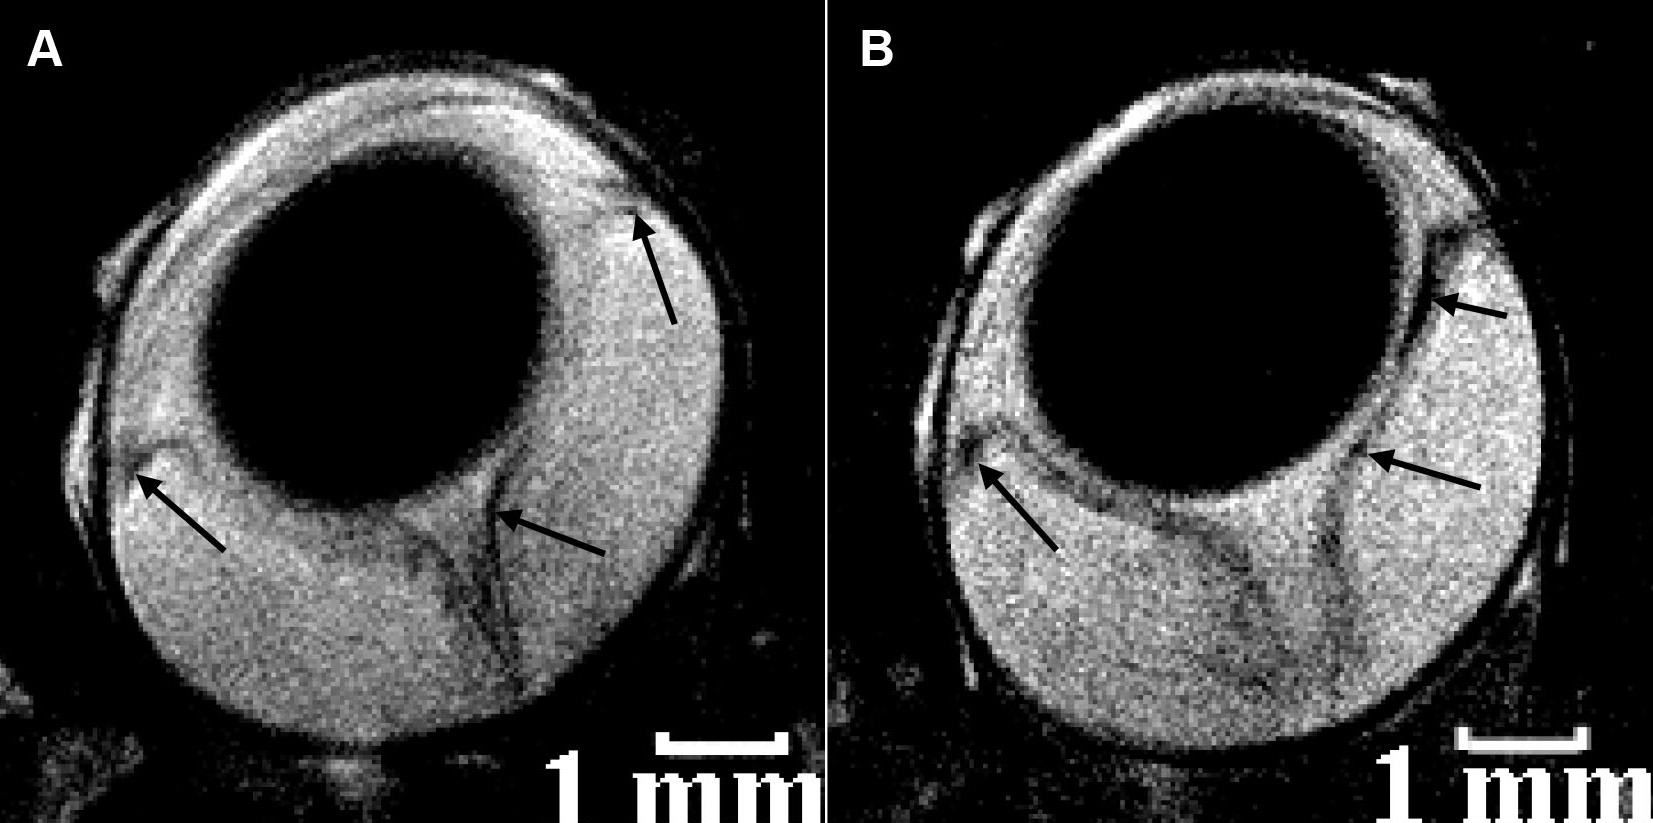
Figure 5. Selected in vivo magnetic
resonance imaging transverse sections of rat eyes at the peak of
experimental autoimmune uveitis. Sites of decreased signal
intensity (arrows) in the region of the retina, iris, and
ciliary body are clearly visible. The rats were injected
intravenously in the tail vein 4 h before magnetic resonance
imaging (MRI) with
A 0.9% physiologic saline and
B
300 μM Sinerem solution in 0.9% physiologic saline. The spatial
resolution of both MRI images is 40×40×700 μm
3, and
their acquisition time was 25 min. All MRI images in this figure
are T
2-weighted. The images were reproduced from [
39]
with permission from the International Society of Magnetic
Resonance.
 Figure 5
of Fanea, Mol Vis 2012; 18:2538-2560.
Figure 5
of Fanea, Mol Vis 2012; 18:2538-2560.