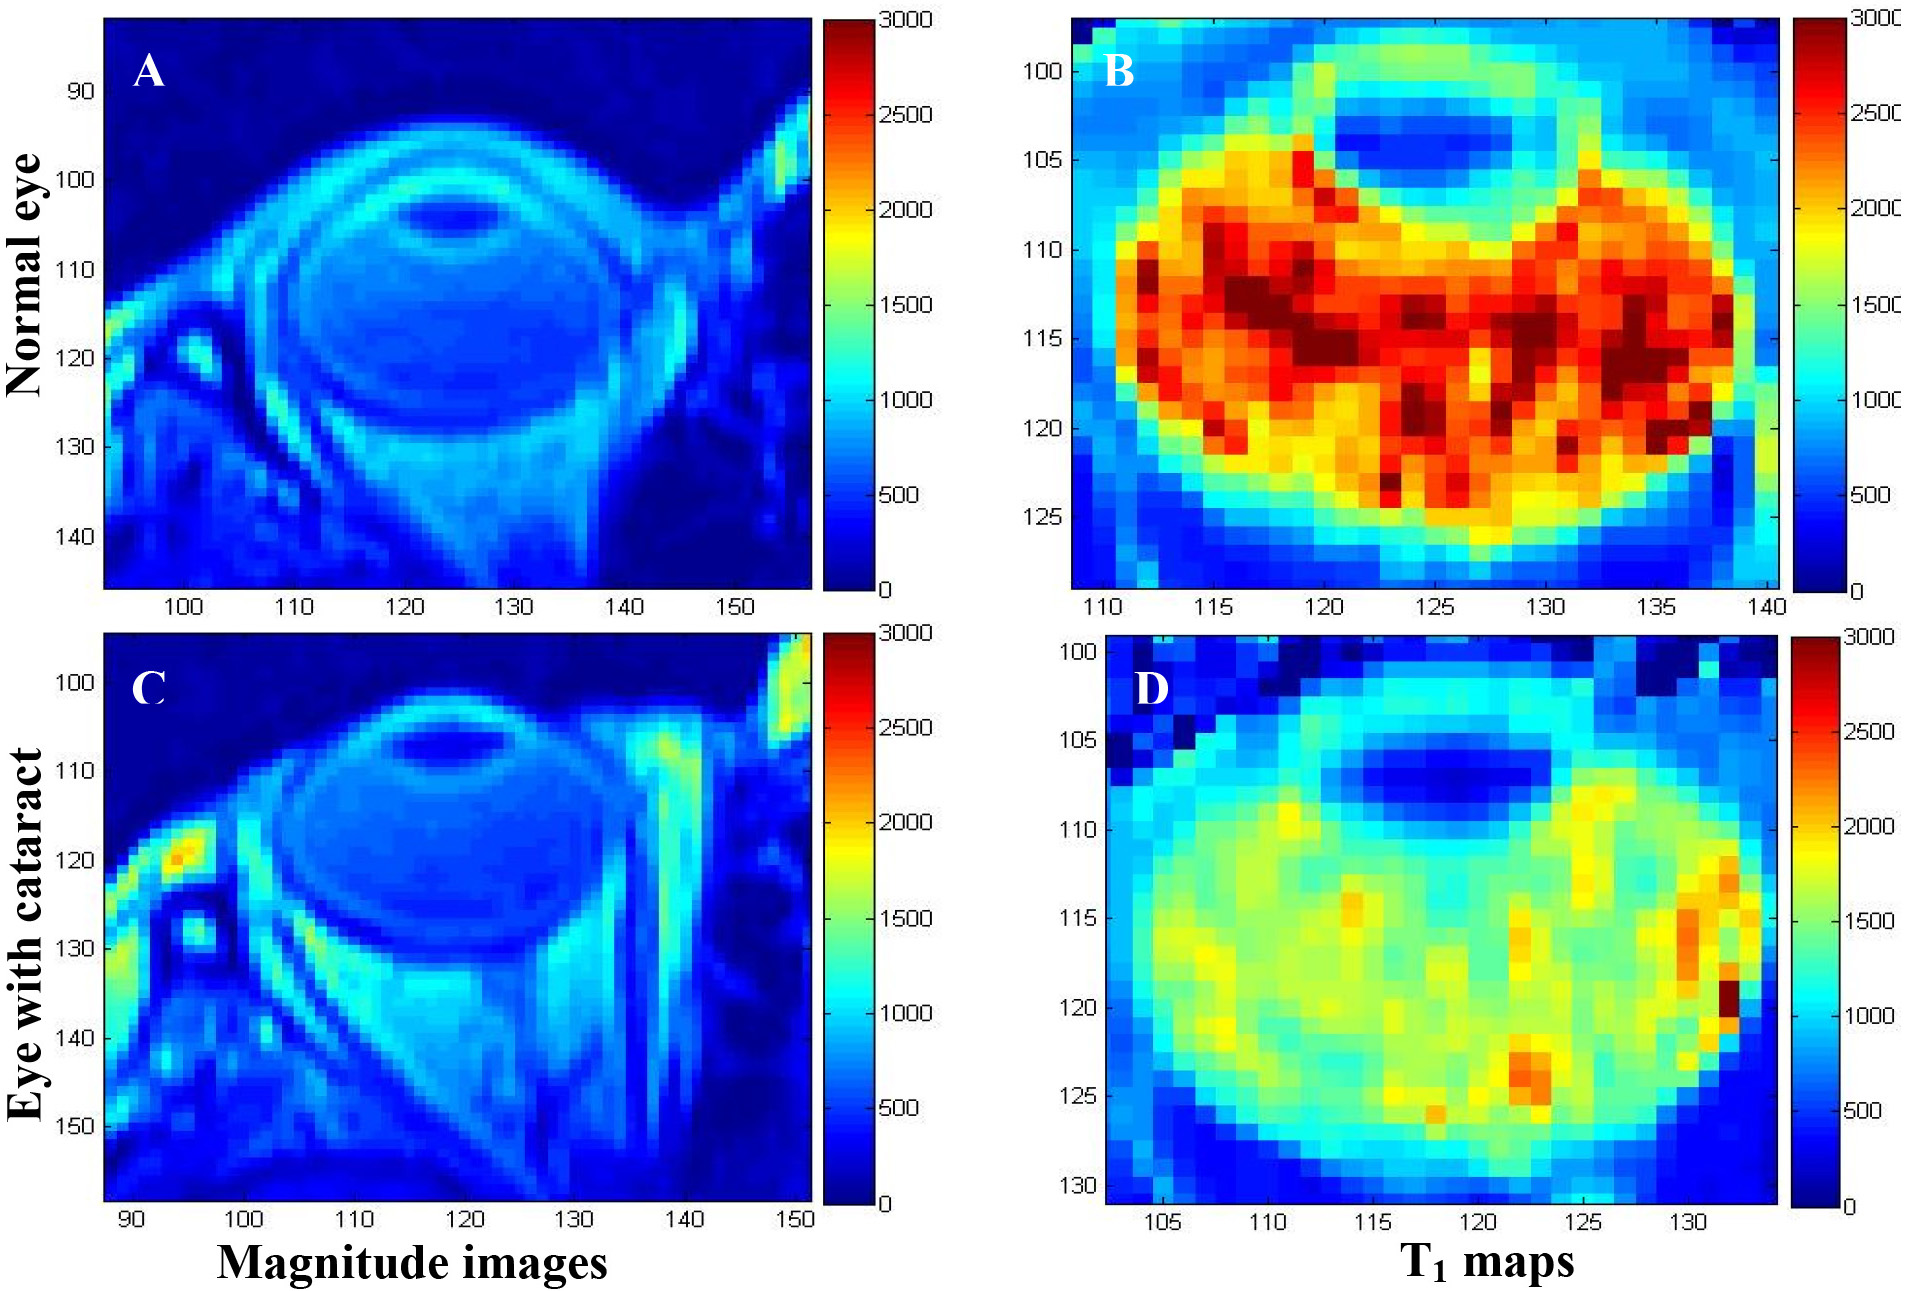
Figure 1. T
2-weighted
magnetic resonance images:
A,
C and the
corresponding T
1 maps:
B,
D: The
image and T
1 map in panels
A and
B
are that of a normal eye, while those in panels
C and
D
are of an eye with cataract. No significant differences were
identified between the magnitude images of the normal eye in
A
and that of the eye with cataract in
C. The T1 values
calculated in ms on the T1 maps show that the T1 values of the
eye with cataract in
D were two times lower than that of
the normal eye in
B in the vitreous and aqueous humors.
The spatial resolution of the images is 780×1560×2000 μm
3,
and the images were acquired in approximately 1 min. The images
were reproduced from [
33]
with permission from the Romanian Society of Medical Imaging.
 Figure 1
of Fanea, Mol Vis 2012; 18:2538-2560.
Figure 1
of Fanea, Mol Vis 2012; 18:2538-2560.