Figure 7. Inter-session (session 1 and session 2) measurement variability (repeatability) for the Agilent 2100 Bioanalyzer is shown.
A: The tear lysozyme measurements (mg/ml) performed during session 1 (y-axis) and session 2 (x-axis) on the same tear samples
are graphed. B: The Bland–Altman plot for various tear samples analyzed for lysozyme content, performed in two sessions, is shown. The x-axis
indicates the mean of the lysozyme content in mg/ml obtained in session 1 and session 2. The y-axis indicates the difference
in measurement between the two sessions. The mean difference of both sessions is 0.04, with an upper specification limit of
0.24 and a lower specification limit of 0.16. C: The concordance correlation coefficients calculated for the two sessions are shown; all values demonstrated the high repeatability
of the Bioanalyzer method.
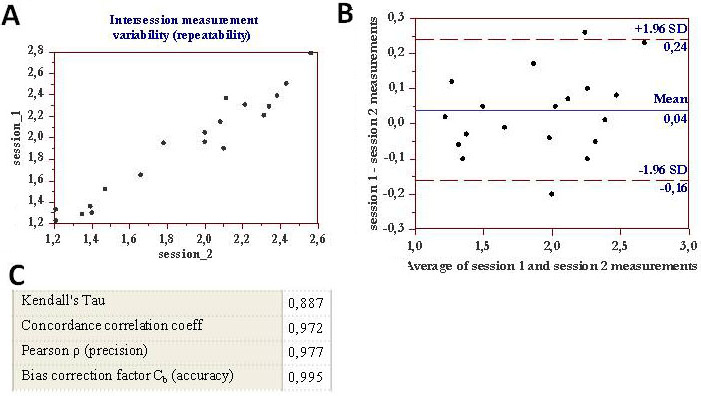
 Figure 7 of
Versura, Mol Vis 2012; 18:2526-2537.
Figure 7 of
Versura, Mol Vis 2012; 18:2526-2537.