Figure 6. Degree of agreement between measurements conducted on replicate specimens. The same tear samples were runned with two methods:
monodimensional sodium dodecyl sulfate-polyacrylamide lectrophoresis (1D SDS–PAGE) electrophoresis and the 2100 Agilent Bioanalyzer
(Protein 230 kit). A: The measurements obtained with 1D-SDS–PAGE electrophoresis (y-axis) and the 2100 Agilent Bioanalyzer (x-axis) are graphed.
B: The Bland–Altman plot for various samples of tears analyzed for lysozyme content, performed with the two methods, is shown.
The x-axis indicates the mean of the lysozyme content in mg/ml obtained with 1D SDS–PAGE electrophoresis and the 2100 Agilent
Bioanalyzer. The y-axis indicates the difference in measurement between the two methods. The mean difference is 0.08, with
an upper specification limit of 0.28 and a lower specification limit of 0.43. C: The concordance correlation coefficients calculated for the two methods are shown; all values demonstrated high correlation
between the two methods.
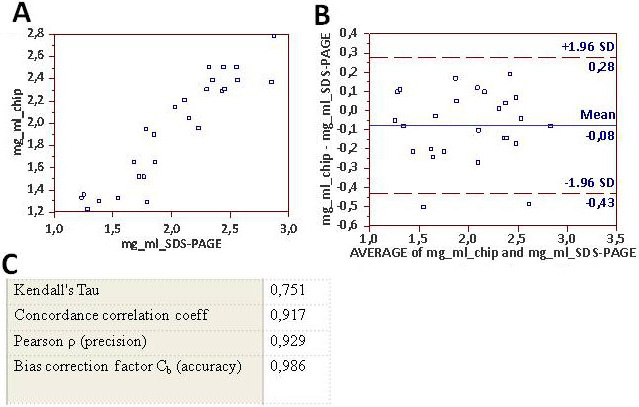
 Figure 6 of
Versura, Mol Vis 2012; 18:2526-2537.
Figure 6 of
Versura, Mol Vis 2012; 18:2526-2537.