Figure 5. Inter-practitioner (Techn1 and Techn2) measurement variability (reproducibility) for the Agilent 2100 Bioanalyzer is shown.
A: The tear lysozyme measurements (mg/ml) performed by Techn1 (y-axis) and by Techn 2 (x-axis) on the same tear samples are
graphed. B: The Bland–Altman plot for various tear samples analyzed for lysozyme content, performed by two different laboratory technicians
(Techn 1 and Techn 2), is shown. The x-axis indicates the mean of the lysozyme content in mg/ml obtained by Techn 1 and Techn
2. The y-axis indicates the difference in measurement between the two technicians. The mean difference of the technicians
is 0.01, with an upper specification limit of 0.23 and a lower specification limit of 0.20. C: The concordance correlation coefficients calculated for the two technicians are shown; all values demonstrated the high
reproducibility of the Bioanalyzer method.
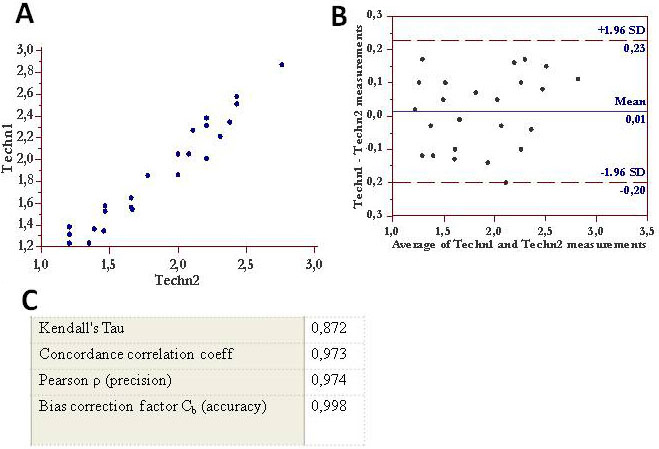
 Figure 5 of
Versura, Mol Vis 2012; 18:2526-2537.
Figure 5 of
Versura, Mol Vis 2012; 18:2526-2537.