Figure 2. Analysis of tear proteins obtained by running aliquots from the same samples in parallel. Tear samples (one to eight) were
runned through the 2100 Bioanalyzer (upper part of the figure, Protein 230 kit, gel-like view), and the 1D SDS–PAGE (lower
part of the figure). The corresponding molecular weight in kDa is reported on the left of the ladder L: and of the prestained protein standard S: The same profiles were obtained for each sample in the two analytical methods.
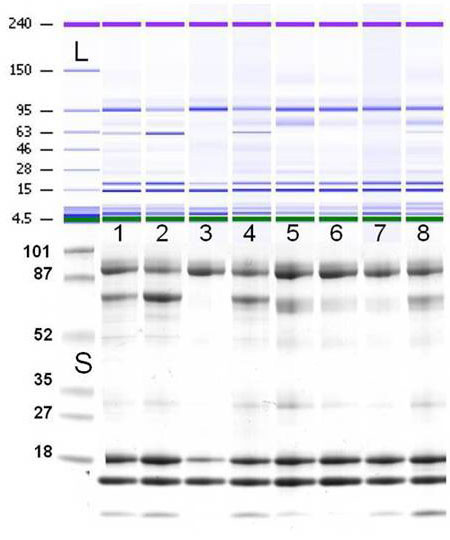
 Figure 2 of
Versura, Mol Vis 2012; 18:2526-2537.
Figure 2 of
Versura, Mol Vis 2012; 18:2526-2537.