Figure 1. Tear protein profile of the same sample (normal subject) run with different LabChip kits; the Protein 80 kit, the Protein
230 kit, and the High Sensitivity Protein 250 kit. On the left of each lane are the markers specific for each LabChip kit
along with the corresponding molecular weight values. L:=ladder, T:=tear sample, degree symbol=upper marker, *=lower marker.
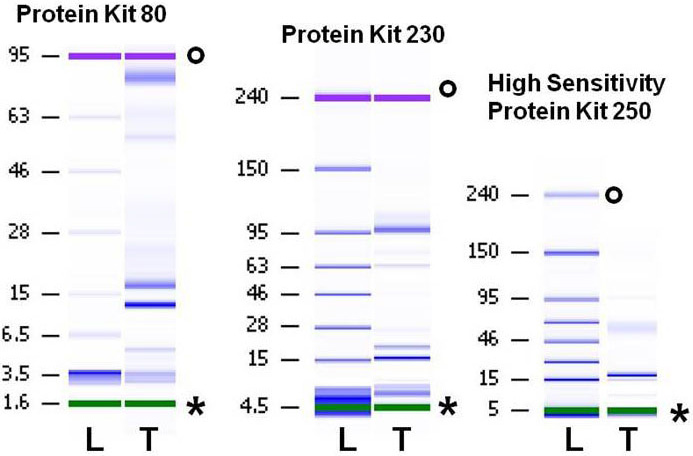
 Figure 1 of
Versura, Mol Vis 2012; 18:2526-2537.
Figure 1 of
Versura, Mol Vis 2012; 18:2526-2537.