Figure 1. Reverse
transcription–polymerase chain reaction (RT–PCR) analysis of
VEGF-A and VEGF-C. RT–PCR analysis of VEGF-A and VEGF-C mRNA
expression, respectively, in ARPE-19 A and HECV B
cells cultured 24 h in standard conditions (CTR) or in the
presence of AGEs (GS). GAPDH was used as the internal control.
VEGF-A and VEGF-C secretion in ARPE-19 C, E: and
HECV D, F: cells, respectively, after 24 h
culture in CTR or in presence of AGEs (GS). The conditioned
media were collected, and ELISA was performed. Concentrations of
VEGFs were calculated from standards curves and normalized to
total protein. The results are representative of at least three
experiments (mean±SEM). *p<0.05; **p<0.01; ***p<0.001.
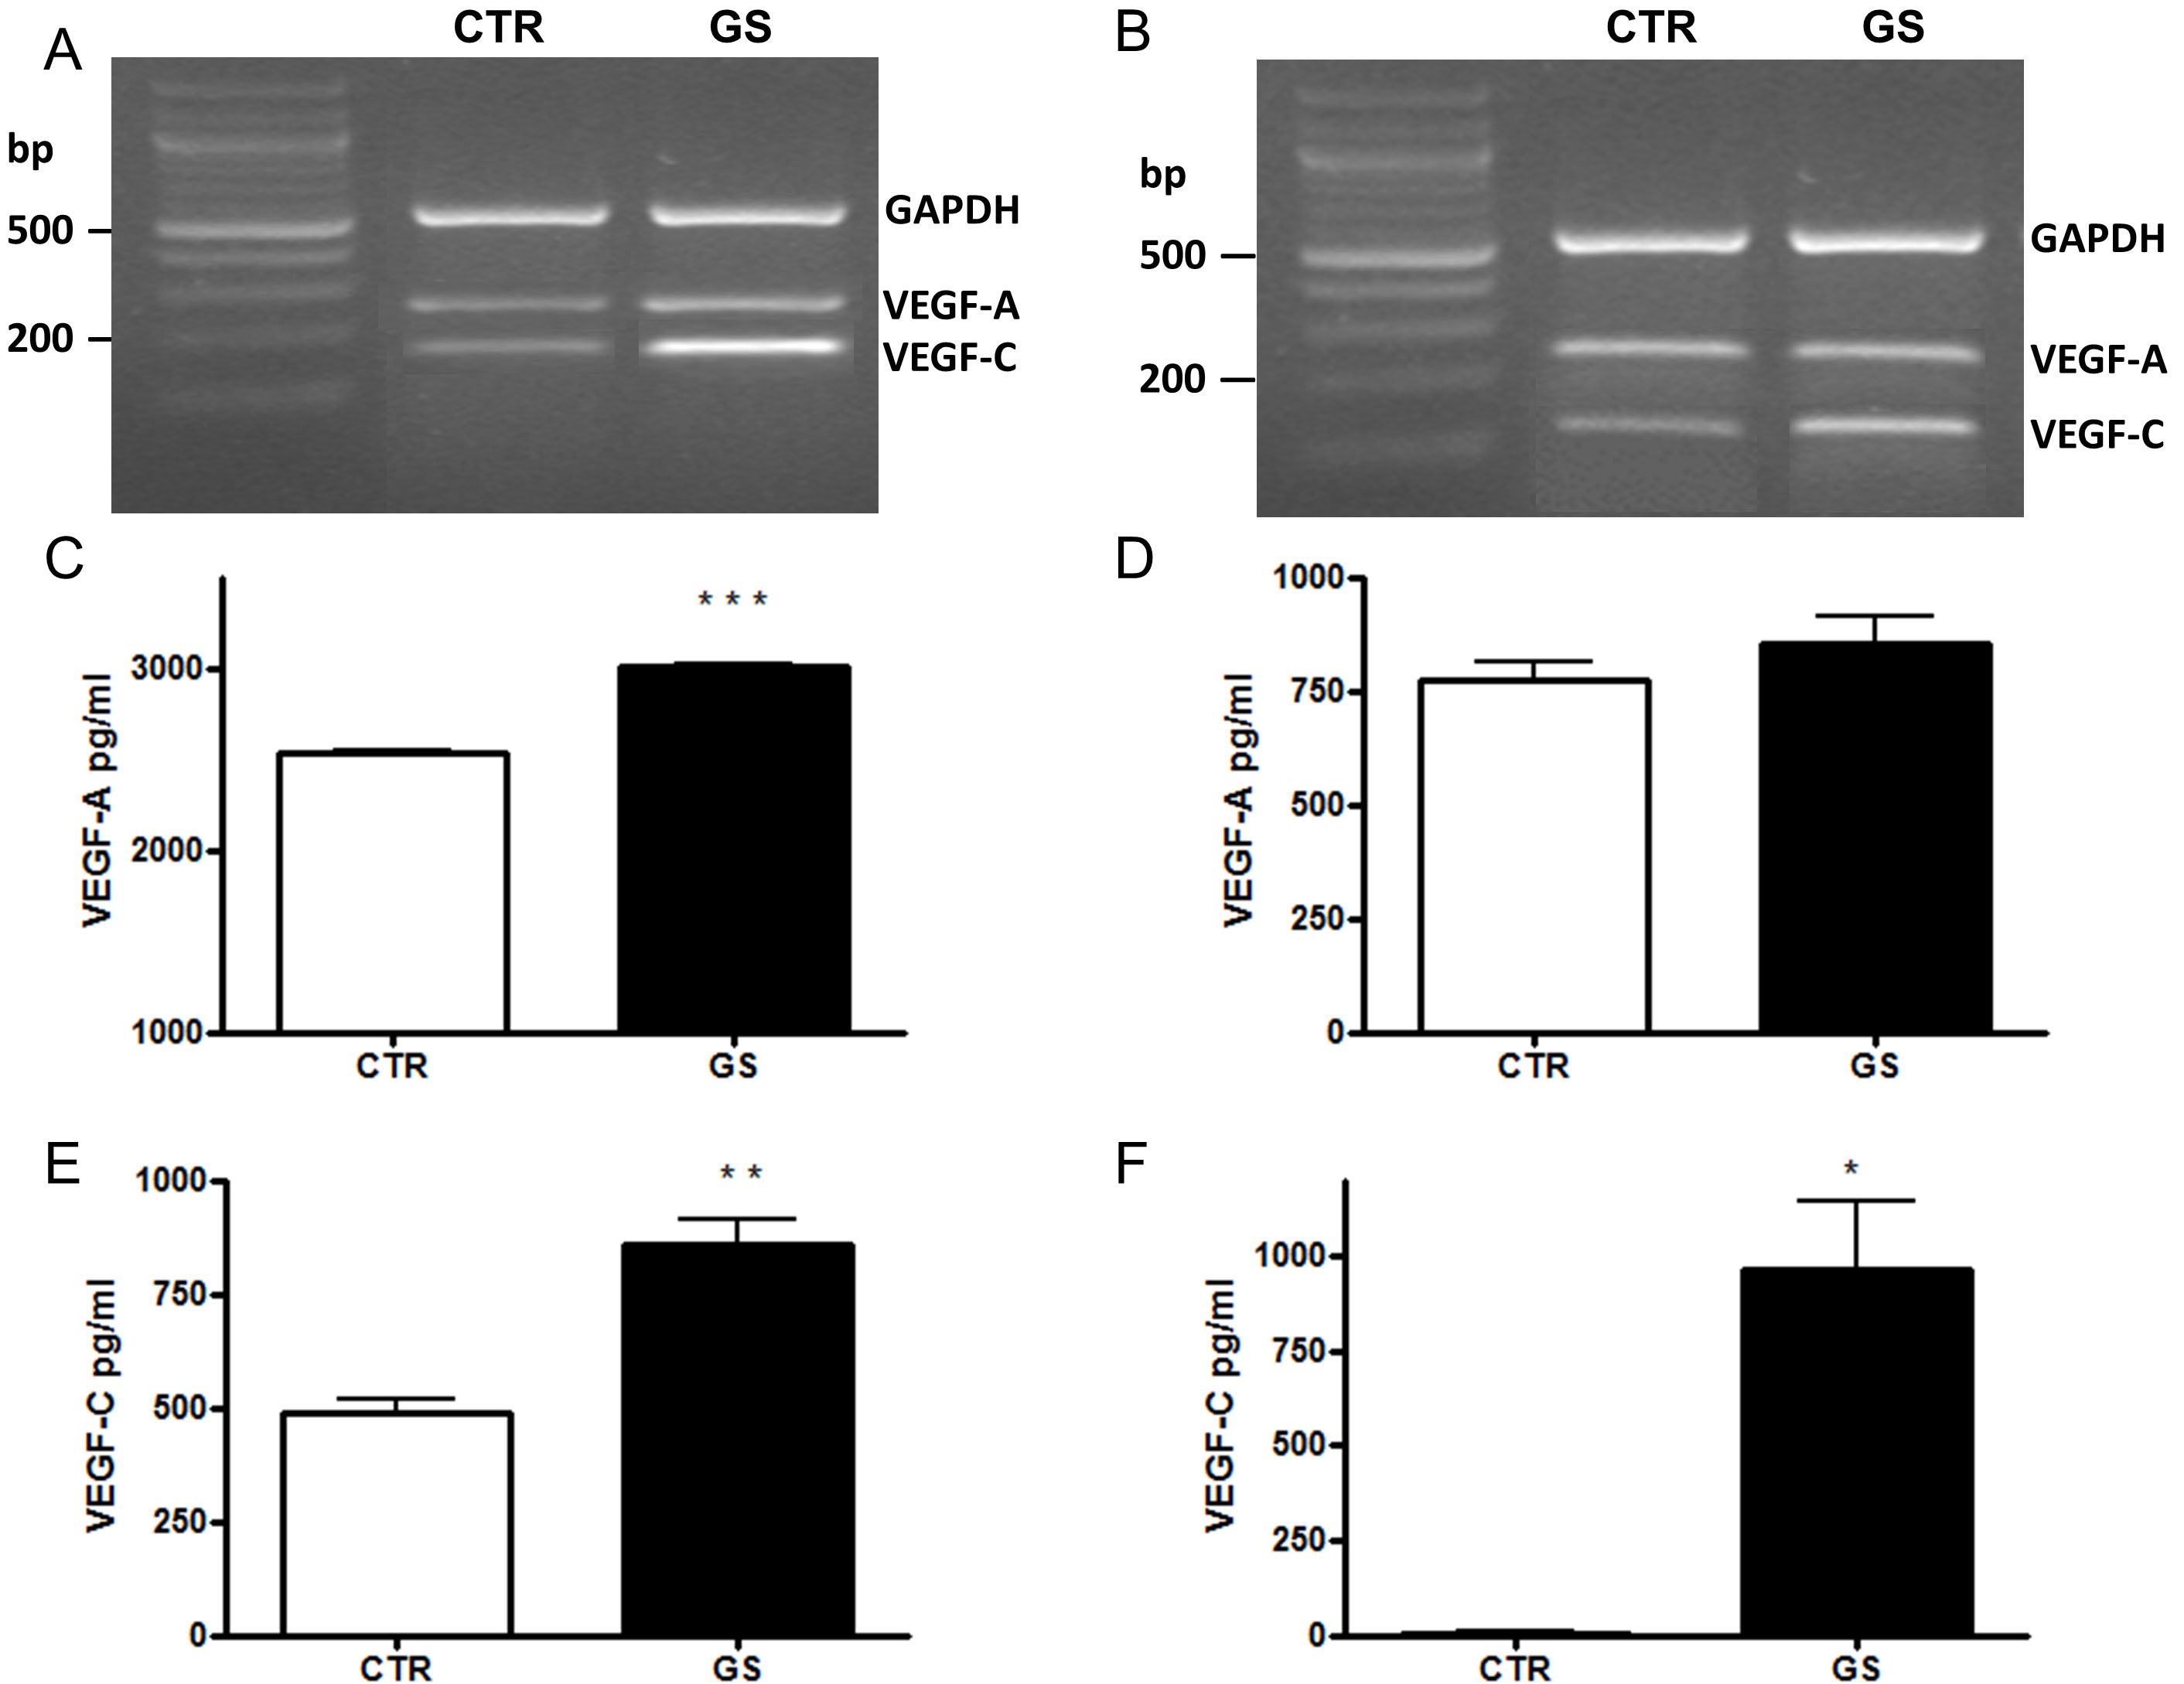
 Figure 1
of Puddu, Mol Vis 2012; 18:2509-2517.
Figure 1
of Puddu, Mol Vis 2012; 18:2509-2517.