Figure 4. Temporal characteristics of
the electroretinogram responses. In A, the peak
latencies of the electroretinogram (ERG) ON (left) and OFF
(right) transients are presented, obtained with 2 s stimuli
under dark adaptation (black squares) and under background
illumination of 5.66 log quanta s−1 μm−2
(green triangles). The results obtained in wild-type flies
(empty symbols, dashed lines) and in hclBT2
mutants (filled symbols, solid lines) are represented. In the
inset, original curves of a wild-type (black) and hclBT2
mutant (red) ON response are superimposed. The beginning of the
records corresponds to the stimulus onset. Stimulus
intensity=6.73 log quanta s−1 μm−2. Peak
latency is delayed in the hclBT2 mutant (two
way analysis of variance [ANOVA], 10−9<p<0.05
for different stimulation conditions). The delay is small in the
dark-adapted responses, being well pronounced under light
adaptation. In B, the results of low-pass filtering of
the ERG ON transients are presented, obtained using 2 s stimuli
in a wild-type fly (black squares) and hclBT2
(red circles) mutant. The amplitudes are normalized to the
amplitudes of the nonfiltered signals (raw signals recorded at a
bandpass of 0–1000 Hz). Stimulus intensity=6.73 log quanta s−1
μm−2. On the left, the results obtained under dark
adaptation (DA) are presented. On the right, the results
obtained under a background of 6.66 log quanta s−1 μm−2
(light adaptation, LA) are presented. The amplitudes of the
mutant responses are decreased to a lesser extent by low-pass
filtering. The difference is greater under light adaptation.
This is indicative of the slower kinetics of the hclB
mutant responses and implies that HCLB receptors may contribute
to the high-pass filtering of the visual signal during light
adaptation.
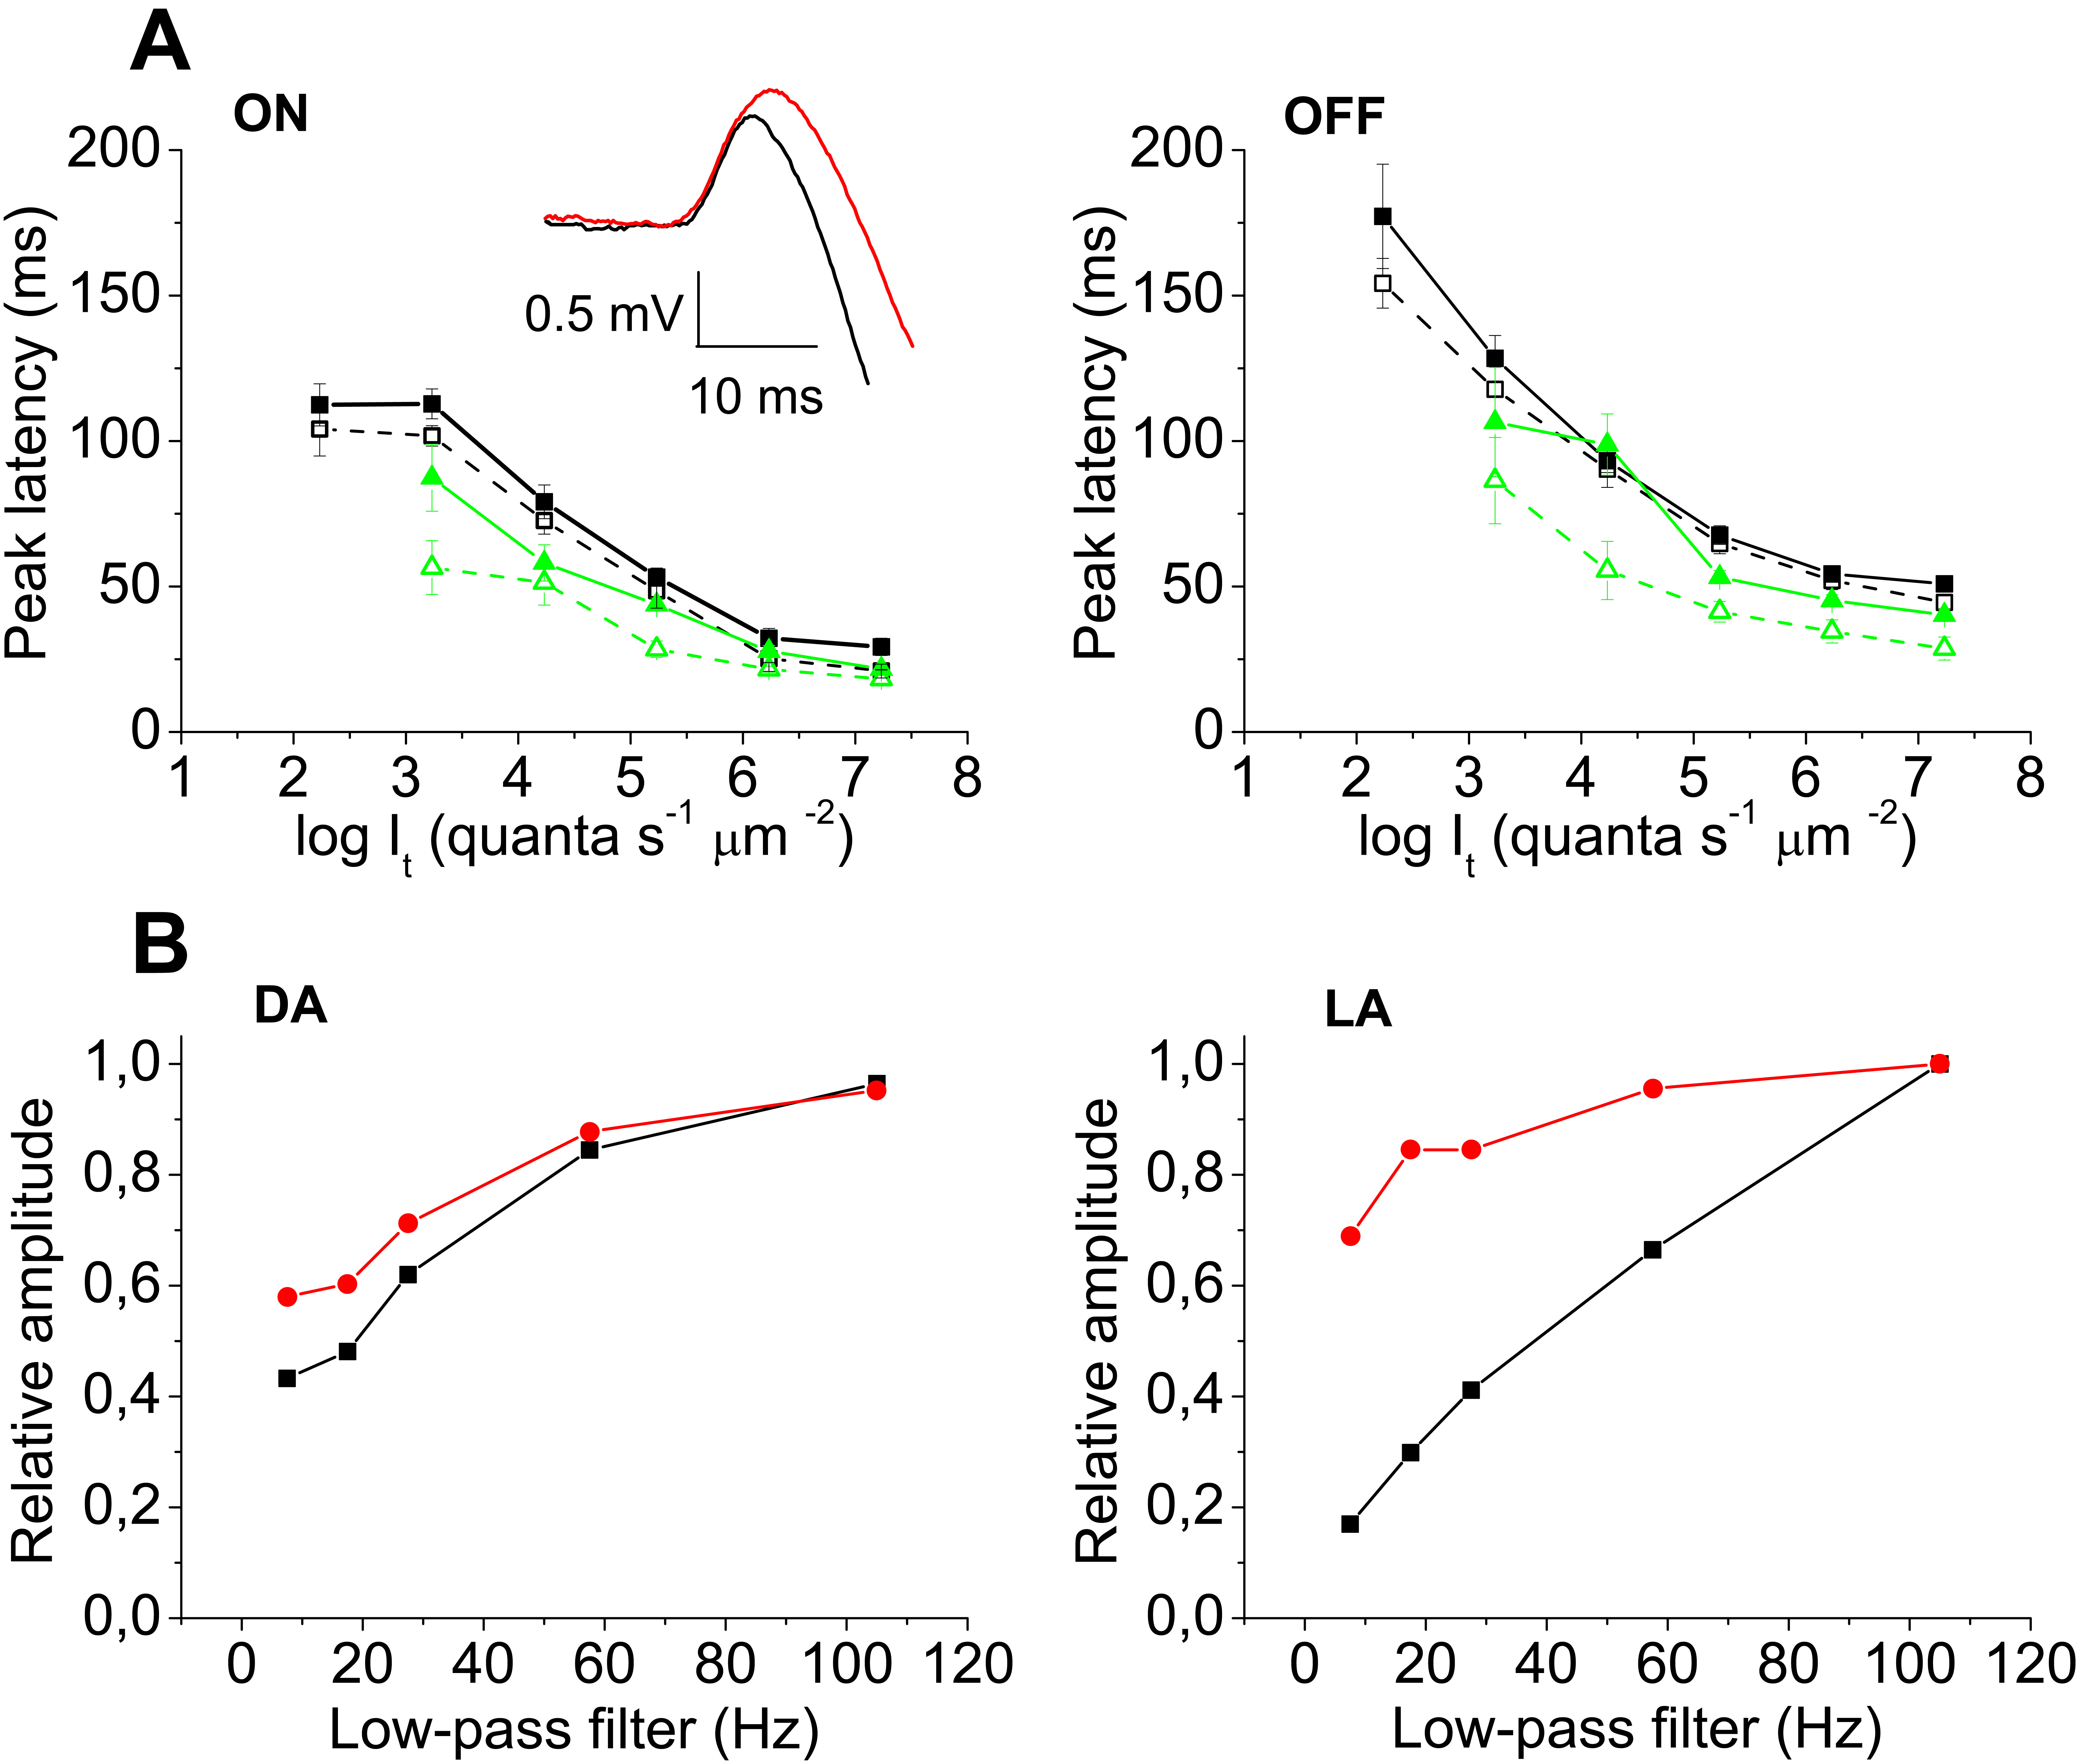
 Figure 4
of Kupenova, Mol Vis 2012; 18:2497-2508.
Figure 4
of Kupenova, Mol Vis 2012; 18:2497-2508.