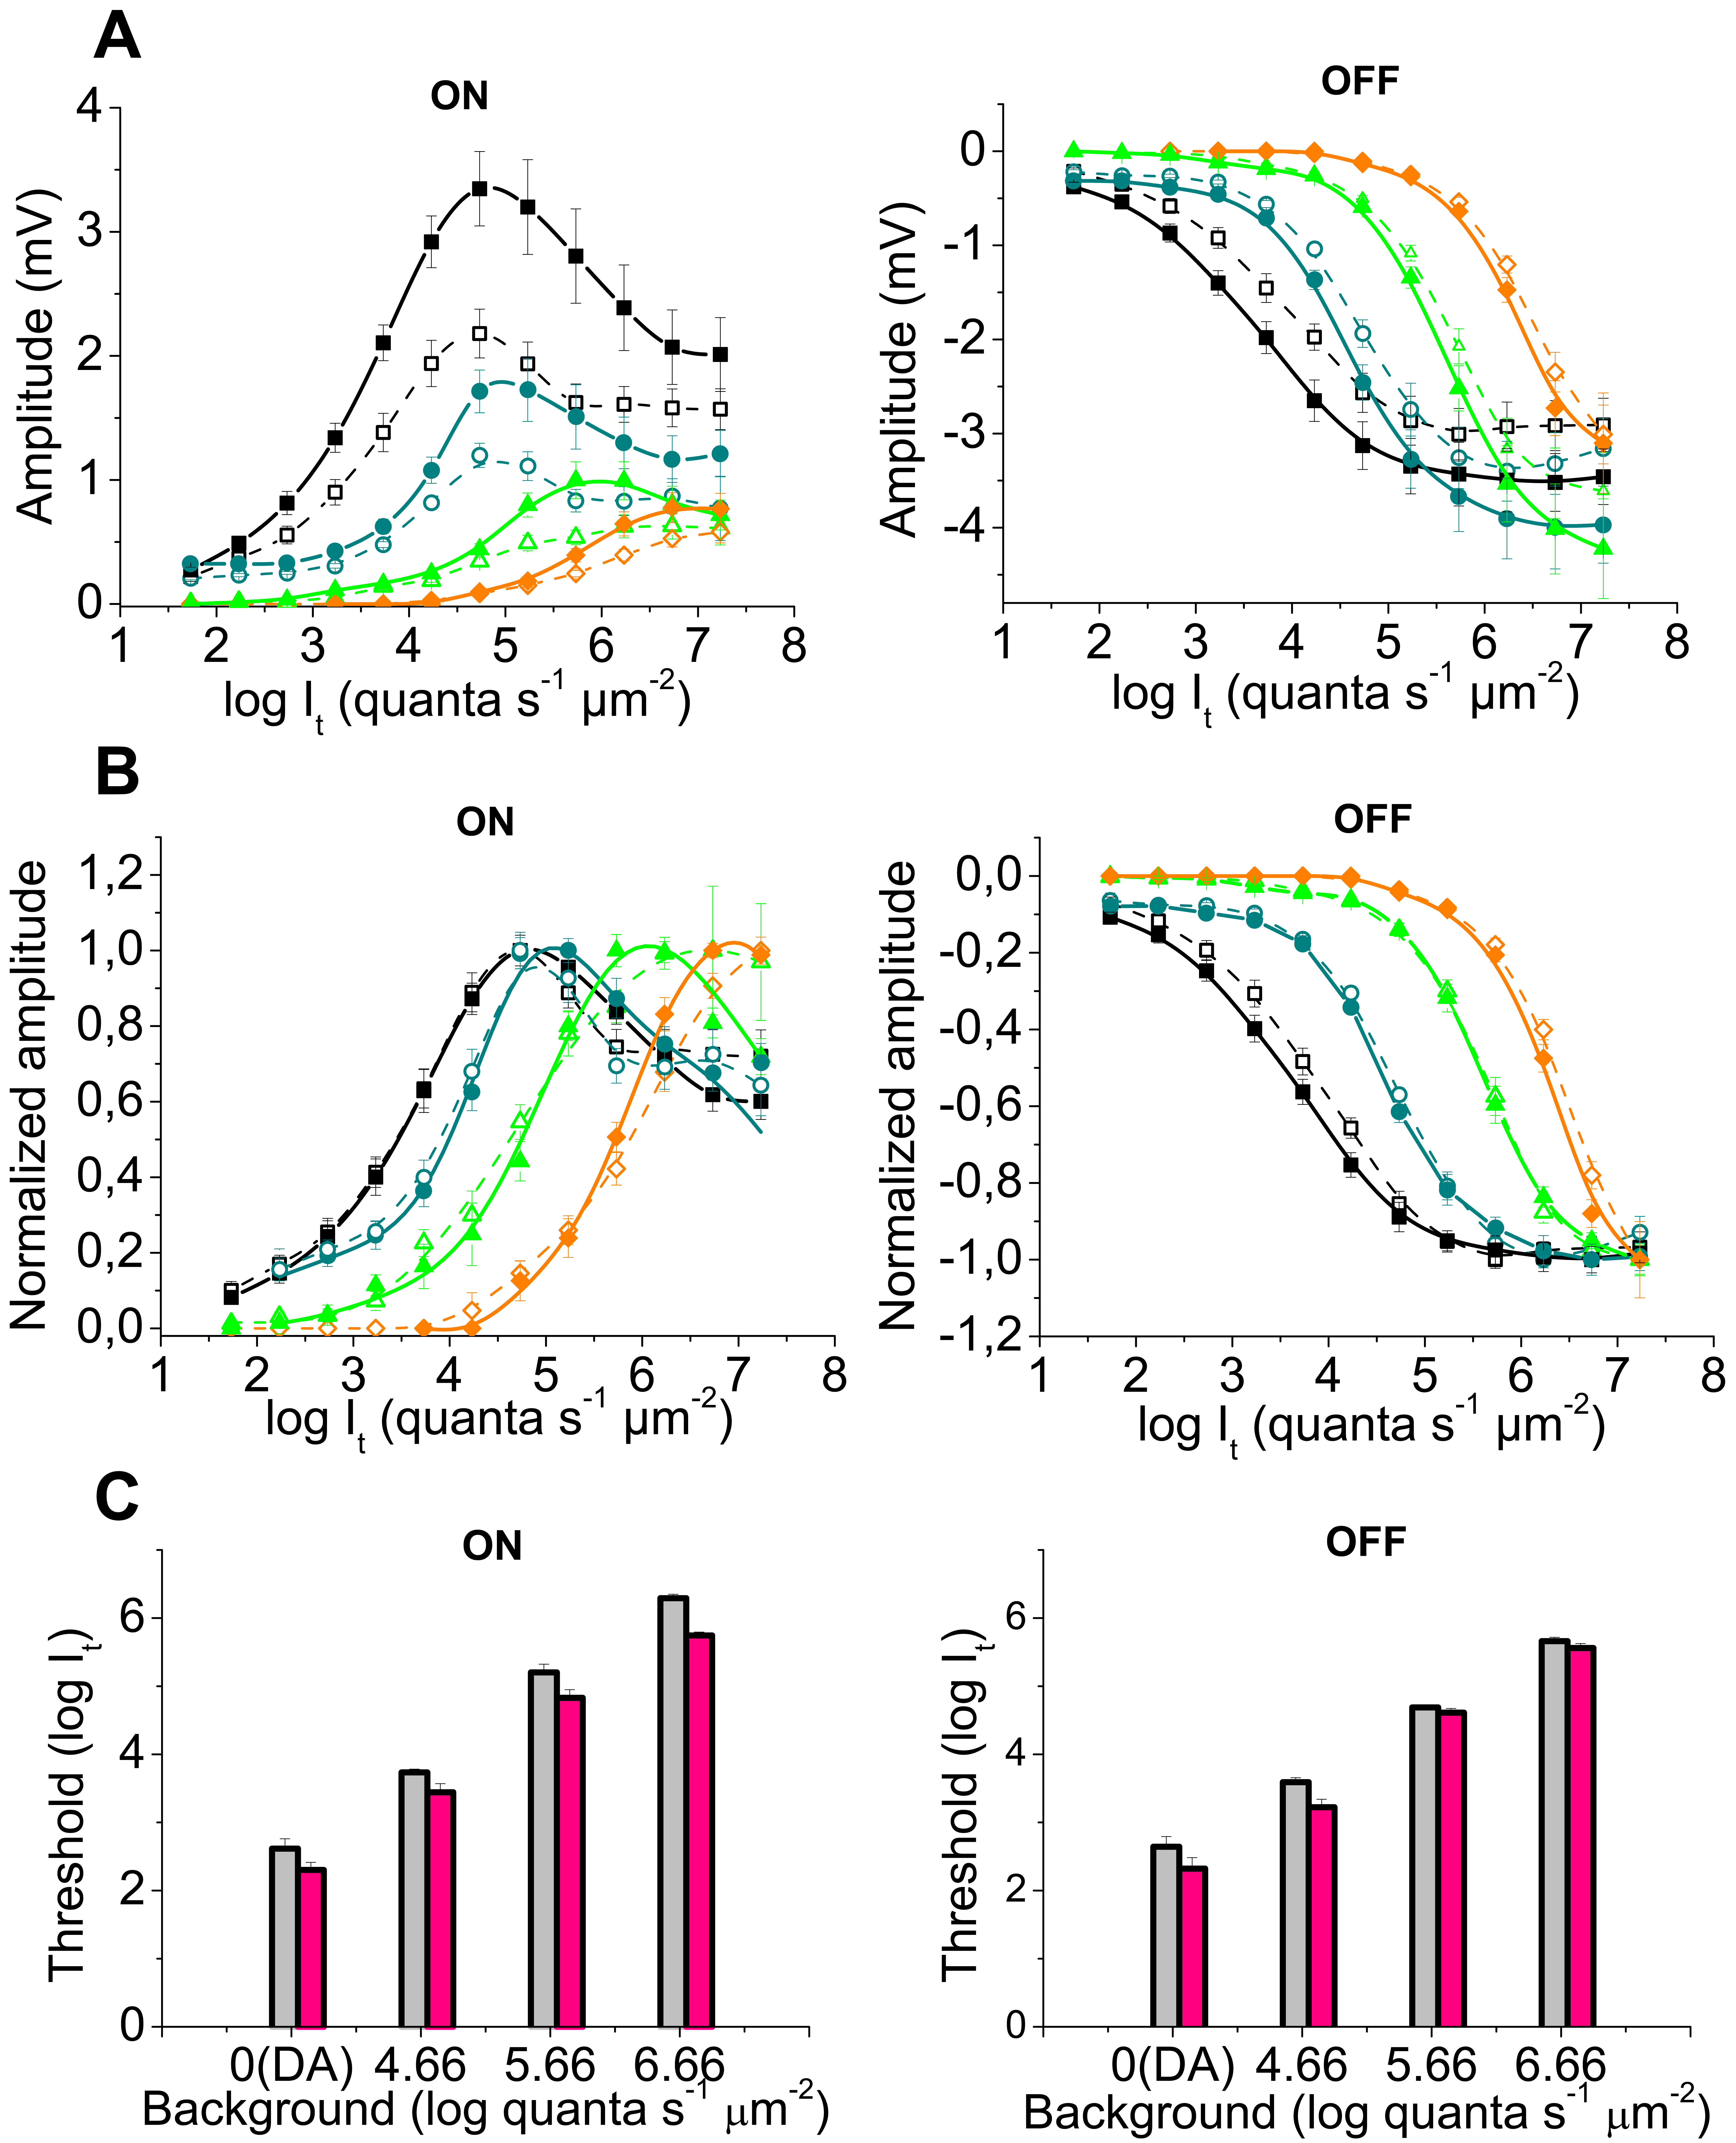
Figure 2. Intensity-response V/logI)
functions and thresholds of the electroretinogram responses to
0.3 s stimuli. In A and B, the V/logI curves of
the ON transients (left) and OFF transients (right) are
presented obtained in the wild-type flies (open symbols, dashed
lines, n=10) and in the null mutant hclBT2
(filled symbols, solid lines, n=10) under dark adaptation (DA,
black squares) as well as under three levels of background
illumination (4.66 log quanta s−1 μm−2,
blue circles; 5.66 log quanta s−1 μm−2,
green triangles; 6.66 log quanta s−1 μm−2,
orange diamonds). In A, the response amplitude in mV
versus log stimulus intensity It) is represented. The
amplitude of both ON and OFF transients is increased in the hclB
mutant, the effect of the mutation being more pronounced with
respect to ON responses (two way analysis of variance [ANOVA],
10−15<p<0.05 for ON and OFF responses under
different backgrounds). In B, the same functions are
normalized to Vmax. The relative sensitivity of the ON and OFF
transients, assessed by the I50 points of the V/log I
curves, is mostly not significantly different between the
wild-type and hclB mutant flies. The steepness of the
V/log I curves of the ON transients is higher in the hclB
mutant and thus the ON-response dynamic range is narrowed (two
way ANOVA, p=0.015). In C, the thresholds of the
electroretinogram (ERG) ON (left) and OFF (right) transients are
presented, obtained under dark adaptation (DA), as well as under
three levels of background illumination. The thresholds are
estimated using 0.5 mV criterion amplitude. The thresholds of
the wild-type flies, (gray columns) and the null mutant hclBT2
(pink columns) are compared. The thresholds of the hclBT2
mutant transients are significantly lower (two way ANOVA,
p=1.22×10⁻⁵ for ON responses; p=0.032 for OFF
responses), indicating an increased absolute sensitivity of the
mutant responses.

 Figure 2
of Kupenova, Mol Vis 2012; 18:2497-2508.
  Figure 2
of Kupenova, Mol Vis 2012; 18:2497-2508.