Figure 1. Individual
electroretinogram records obtained under different light
stimulation conditions from a wild-type fly -OR/Df(3R)E79,
denoted as control and two hclB mutants—hclBT2/Df(3R)E79,
a null mutant, and hclBT1/Df(3R)E79, denoted as hclBT2
and hclBT1, respectively. In A and B,
electroretinogram (ERG) responses to 0.3 s and 2 s stimuli are
represented, respectively. The numbers on the left denote test
stimulus intensities (in log quanta s−1 μm−2).
Responses obtained under dark adaptation (left) and light
adaptation with a background of 4.66 log quanta s−1
μm−2 intensity (right) are represented. It is seen
that the receptor component of the ERG has similar amplitude in
both wild-type and mutant flies, while the ON and OFF
transients’ amplitudes are significantly greater in the hclB
mutants. It can also be observed that the overall duration of
the transients is increased in the mutant flies.
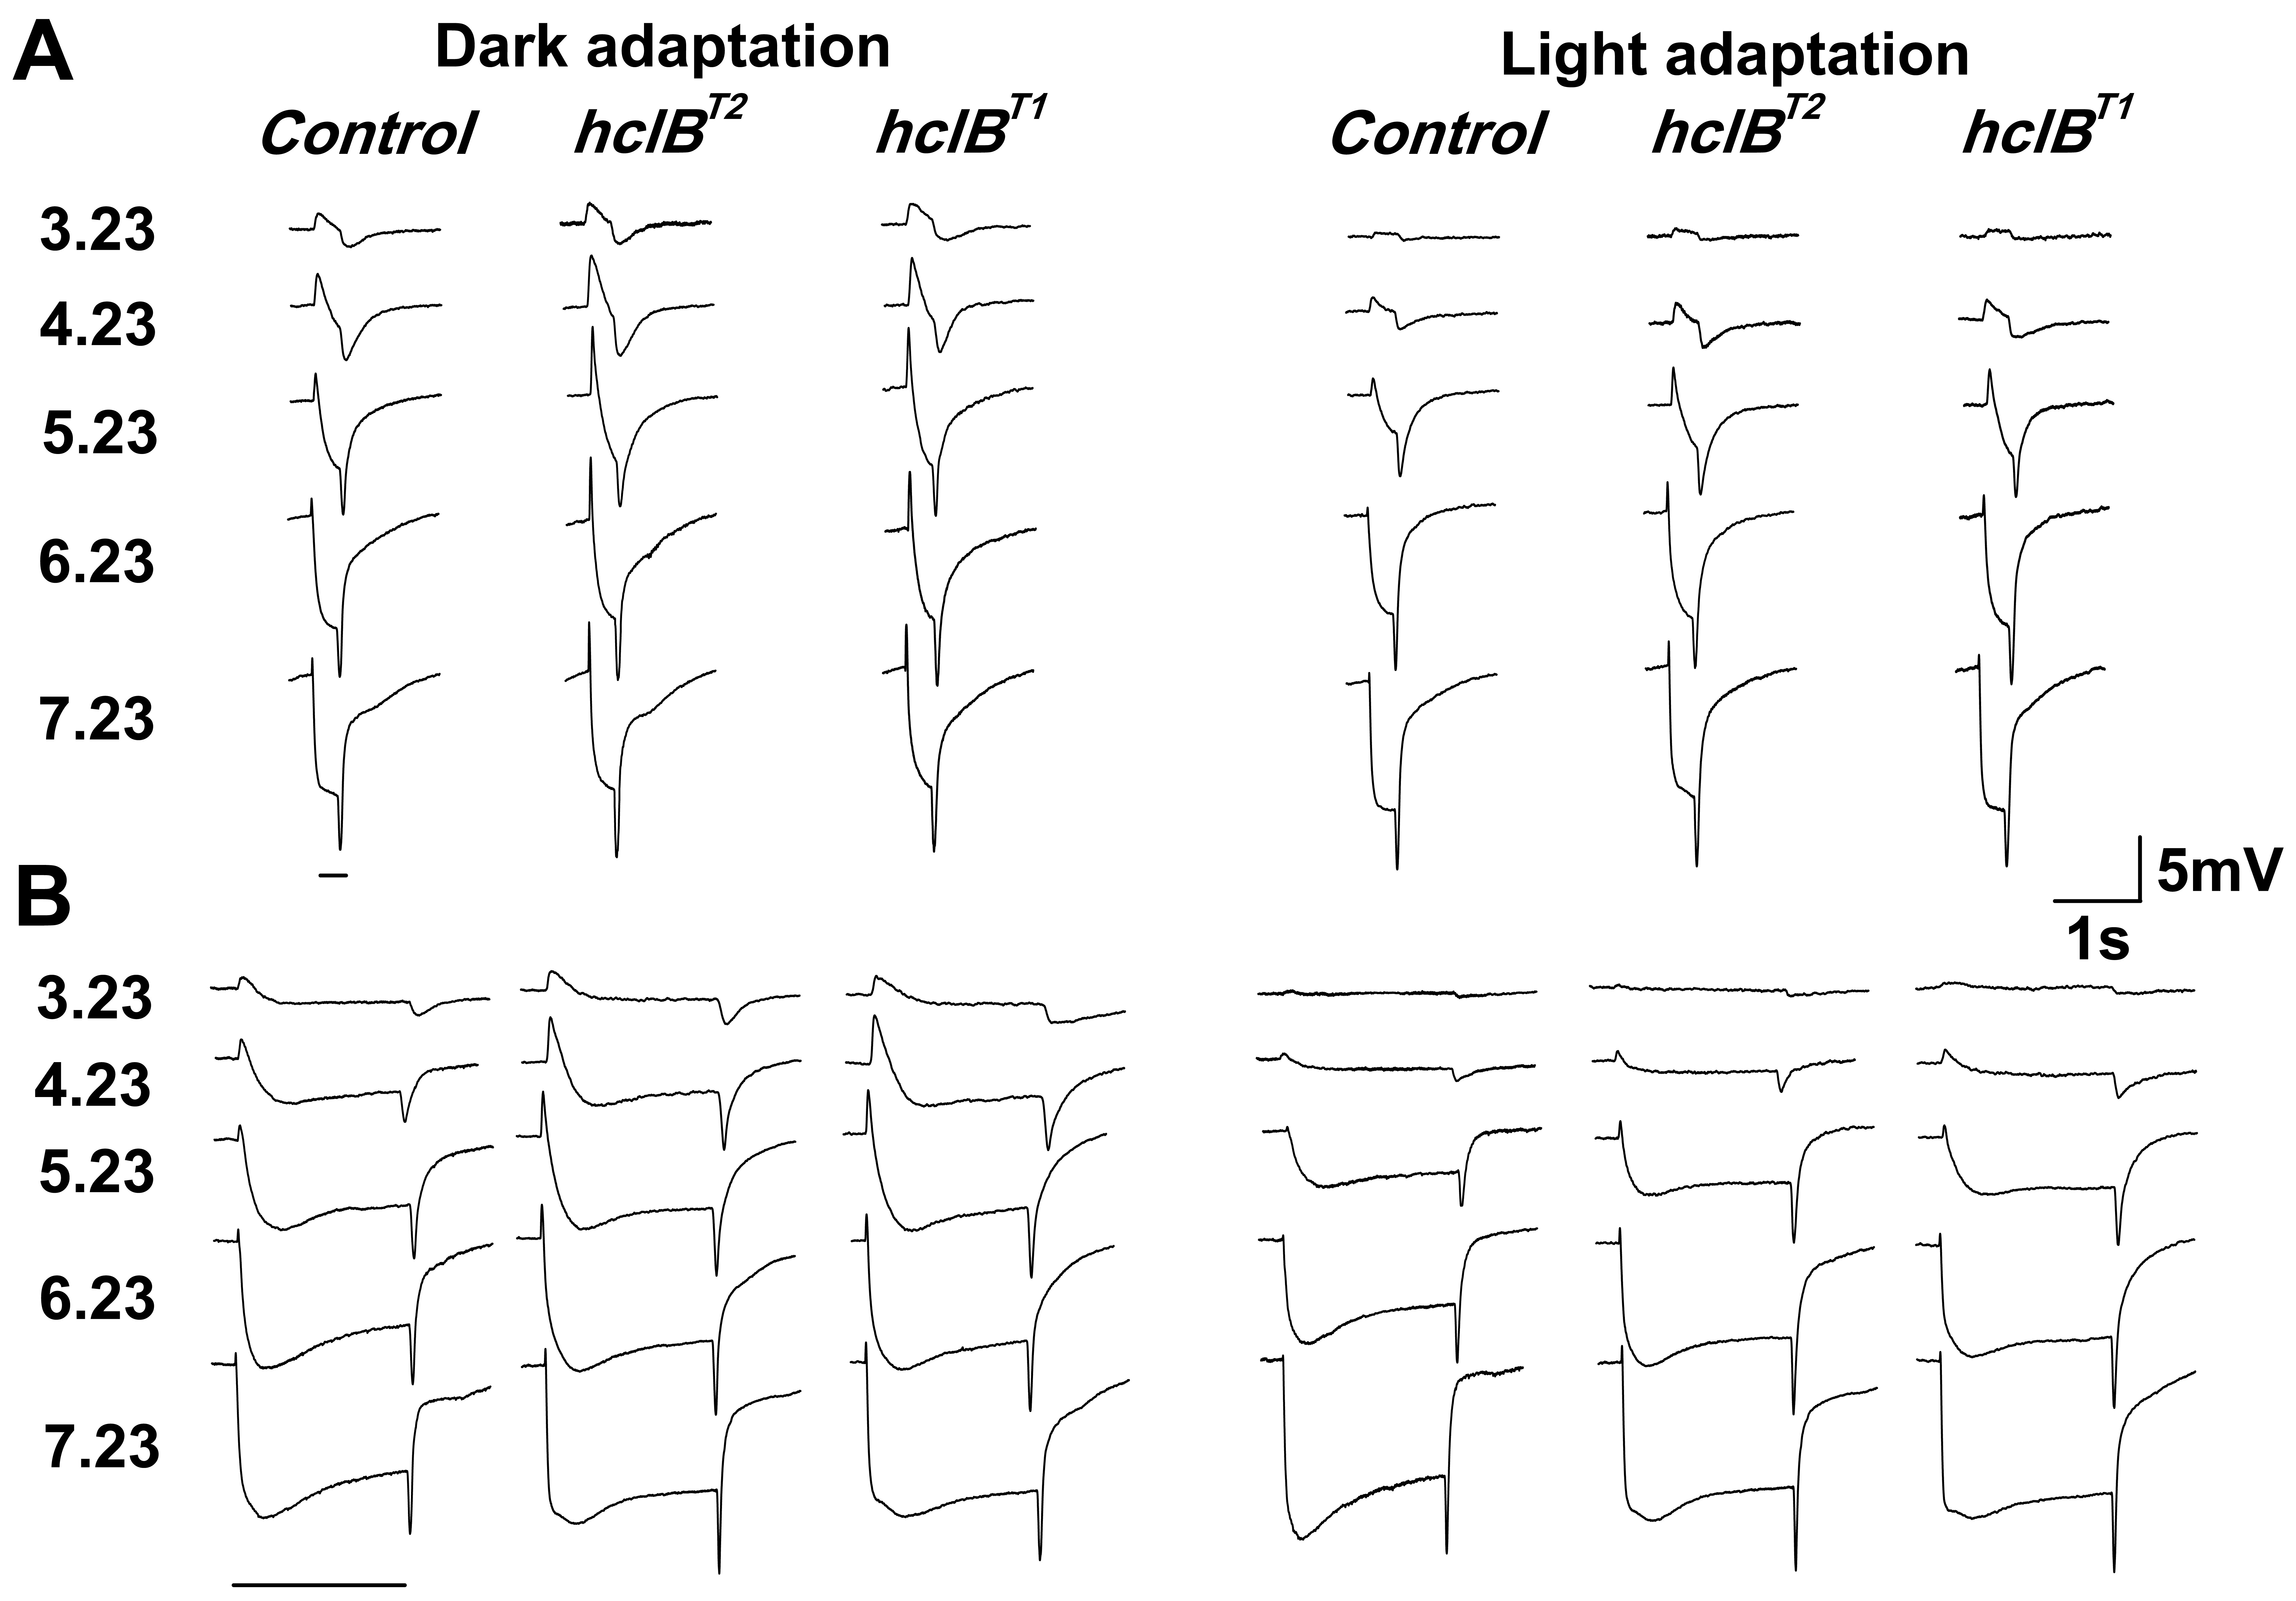
 Figure 1
of Kupenova, Mol Vis 2012; 18:2497-2508.
Figure 1
of Kupenova, Mol Vis 2012; 18:2497-2508.