Figure 2. Fundus autofluorescence.
Representative images of affected patients 1 (A, B),
3 (C, D), 4 (E, F), and unaffected
patient 5 (G, H, I) are presented. Image I
corresponds to the black square region in image H.
Geographic atrophy was a prominent feature of Stargardt disease
in the three affected patients, with widespread focal fundus
autofluorescence (FAF) abnormalities observed in patients 1 and
3 also. Images of patient 5 revealed sparse discrete
hyperautofluorescent macular lesions bilaterally. All subjects
exhibited peripapillary sparing on FAF imaging. A corresponding
size bar for images A-H is included in A.
A size bar for I is included within the image.
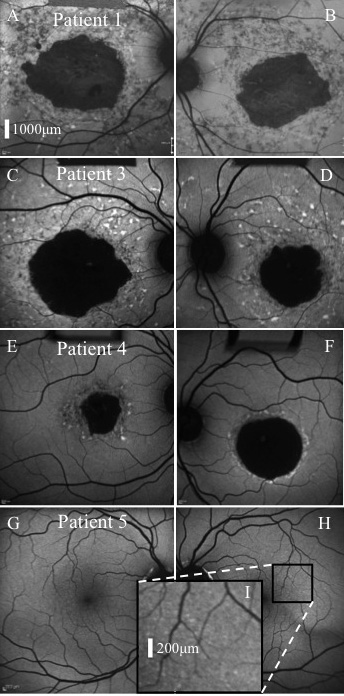
 Figure 2
of Burke, Mol Vis 2012; 18:227-233.
Figure 2
of Burke, Mol Vis 2012; 18:227-233.