Figure 9. Correlation between the pressure-insult and RGC damage. Regression analysis of A: whole retina, B: central, C: middle, D: peripheral, E: superior, F: temporal, G: inferior, and H: nasal retinal areas. Linear regression analysis revealed a significant negative correlation between the pressure-insult
and the RGC survival rate, calculated as a percentage of the laser-treated RGC density compared with the contralateral control
in whole retina (r=0.75, p=0.0008), in the area from optic disc (central; r=0.61, p=0.0119, middle; r=0.08, p=0.0002, peripheral;
r=0.73, p=0.0012) and each retinal quadrant (superior; r=0.64, p=0.0082, temporal; r=0.61, p=0.0124, inferior; r=0.63, p=0.0086,
nasal; r=0.51, p=0.0427).
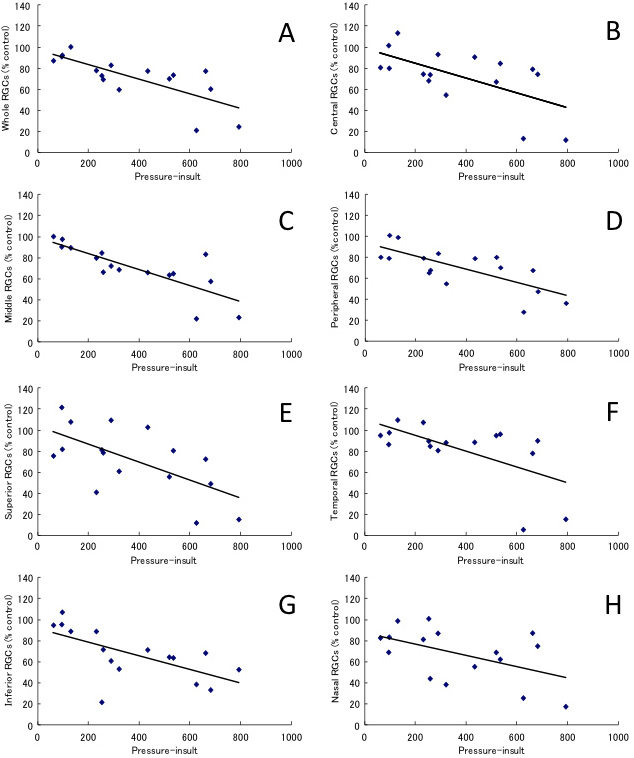
 Figure 9 of
Tsuruga, Mol Vis 2012; 18:2468-2478.
Figure 9 of
Tsuruga, Mol Vis 2012; 18:2468-2478.