Figure 6. IOP elevation in the acute stage after laser photocoagulation. A: IOPs at 1, 2, 3, and 4 h after laser photocoagulation were measured using a TonoLab. B: IOPs at 12, 24, 48, and 72 h after laser photocoagulation were measured by the microneedle method. Data are mean±standard
deviation (SD). n=5–6. The IOP of the treated eyes was significantly higher in each time point compared with the IOP of the
sham-operated contralateral eyes by a paired t test. (*p<0.05, ** p<0.01).
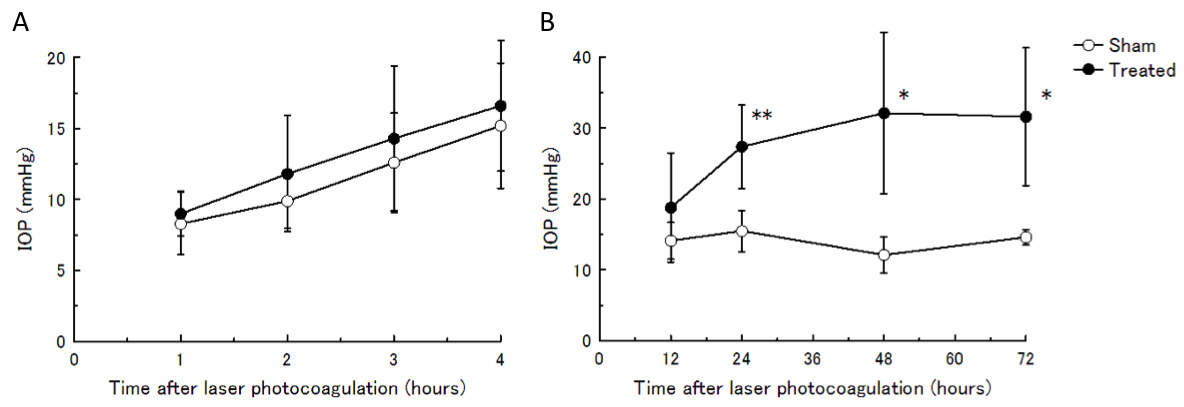
 Figure 6 of
Tsuruga, Mol Vis 2012; 18:2468-2478.
Figure 6 of
Tsuruga, Mol Vis 2012; 18:2468-2478.