Figure 5. Intraocular pressure of ocular hypertension model eyes. Time courses of IOP in the laser-treated eyes and the contralateral
control eyes for 8 weeks are indicated. n=20. Data are mean±standard deviation (SD). The IOP of the treated eyes was significantly
higher in each time point compared with the IOP of the sham-operated contralateral eyes by a paired t test. (**p<0.01, *** p<0.001).
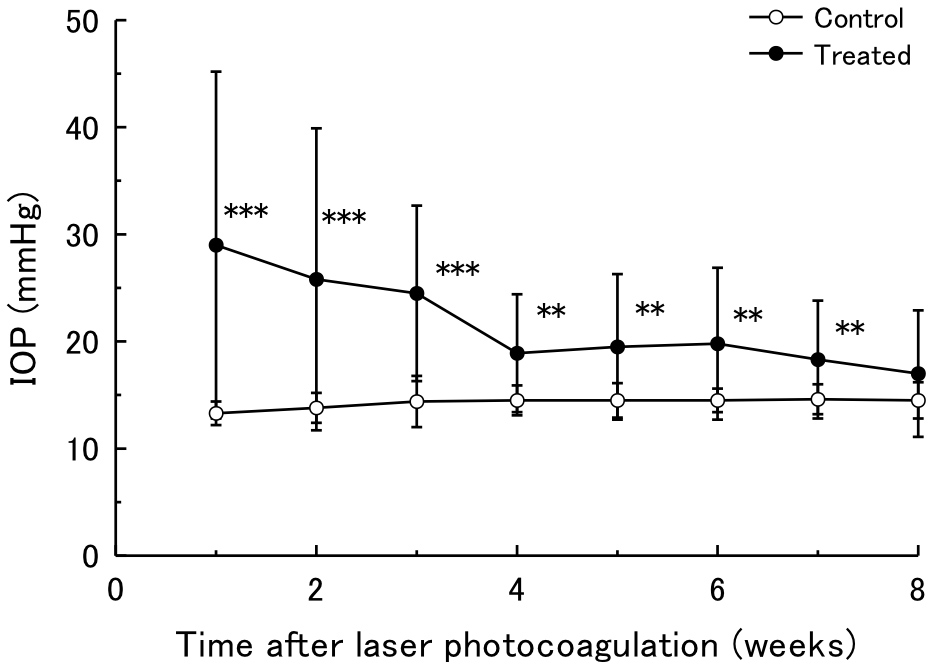
 Figure 5 of
Tsuruga, Mol Vis 2012; 18:2468-2478.
Figure 5 of
Tsuruga, Mol Vis 2012; 18:2468-2478.