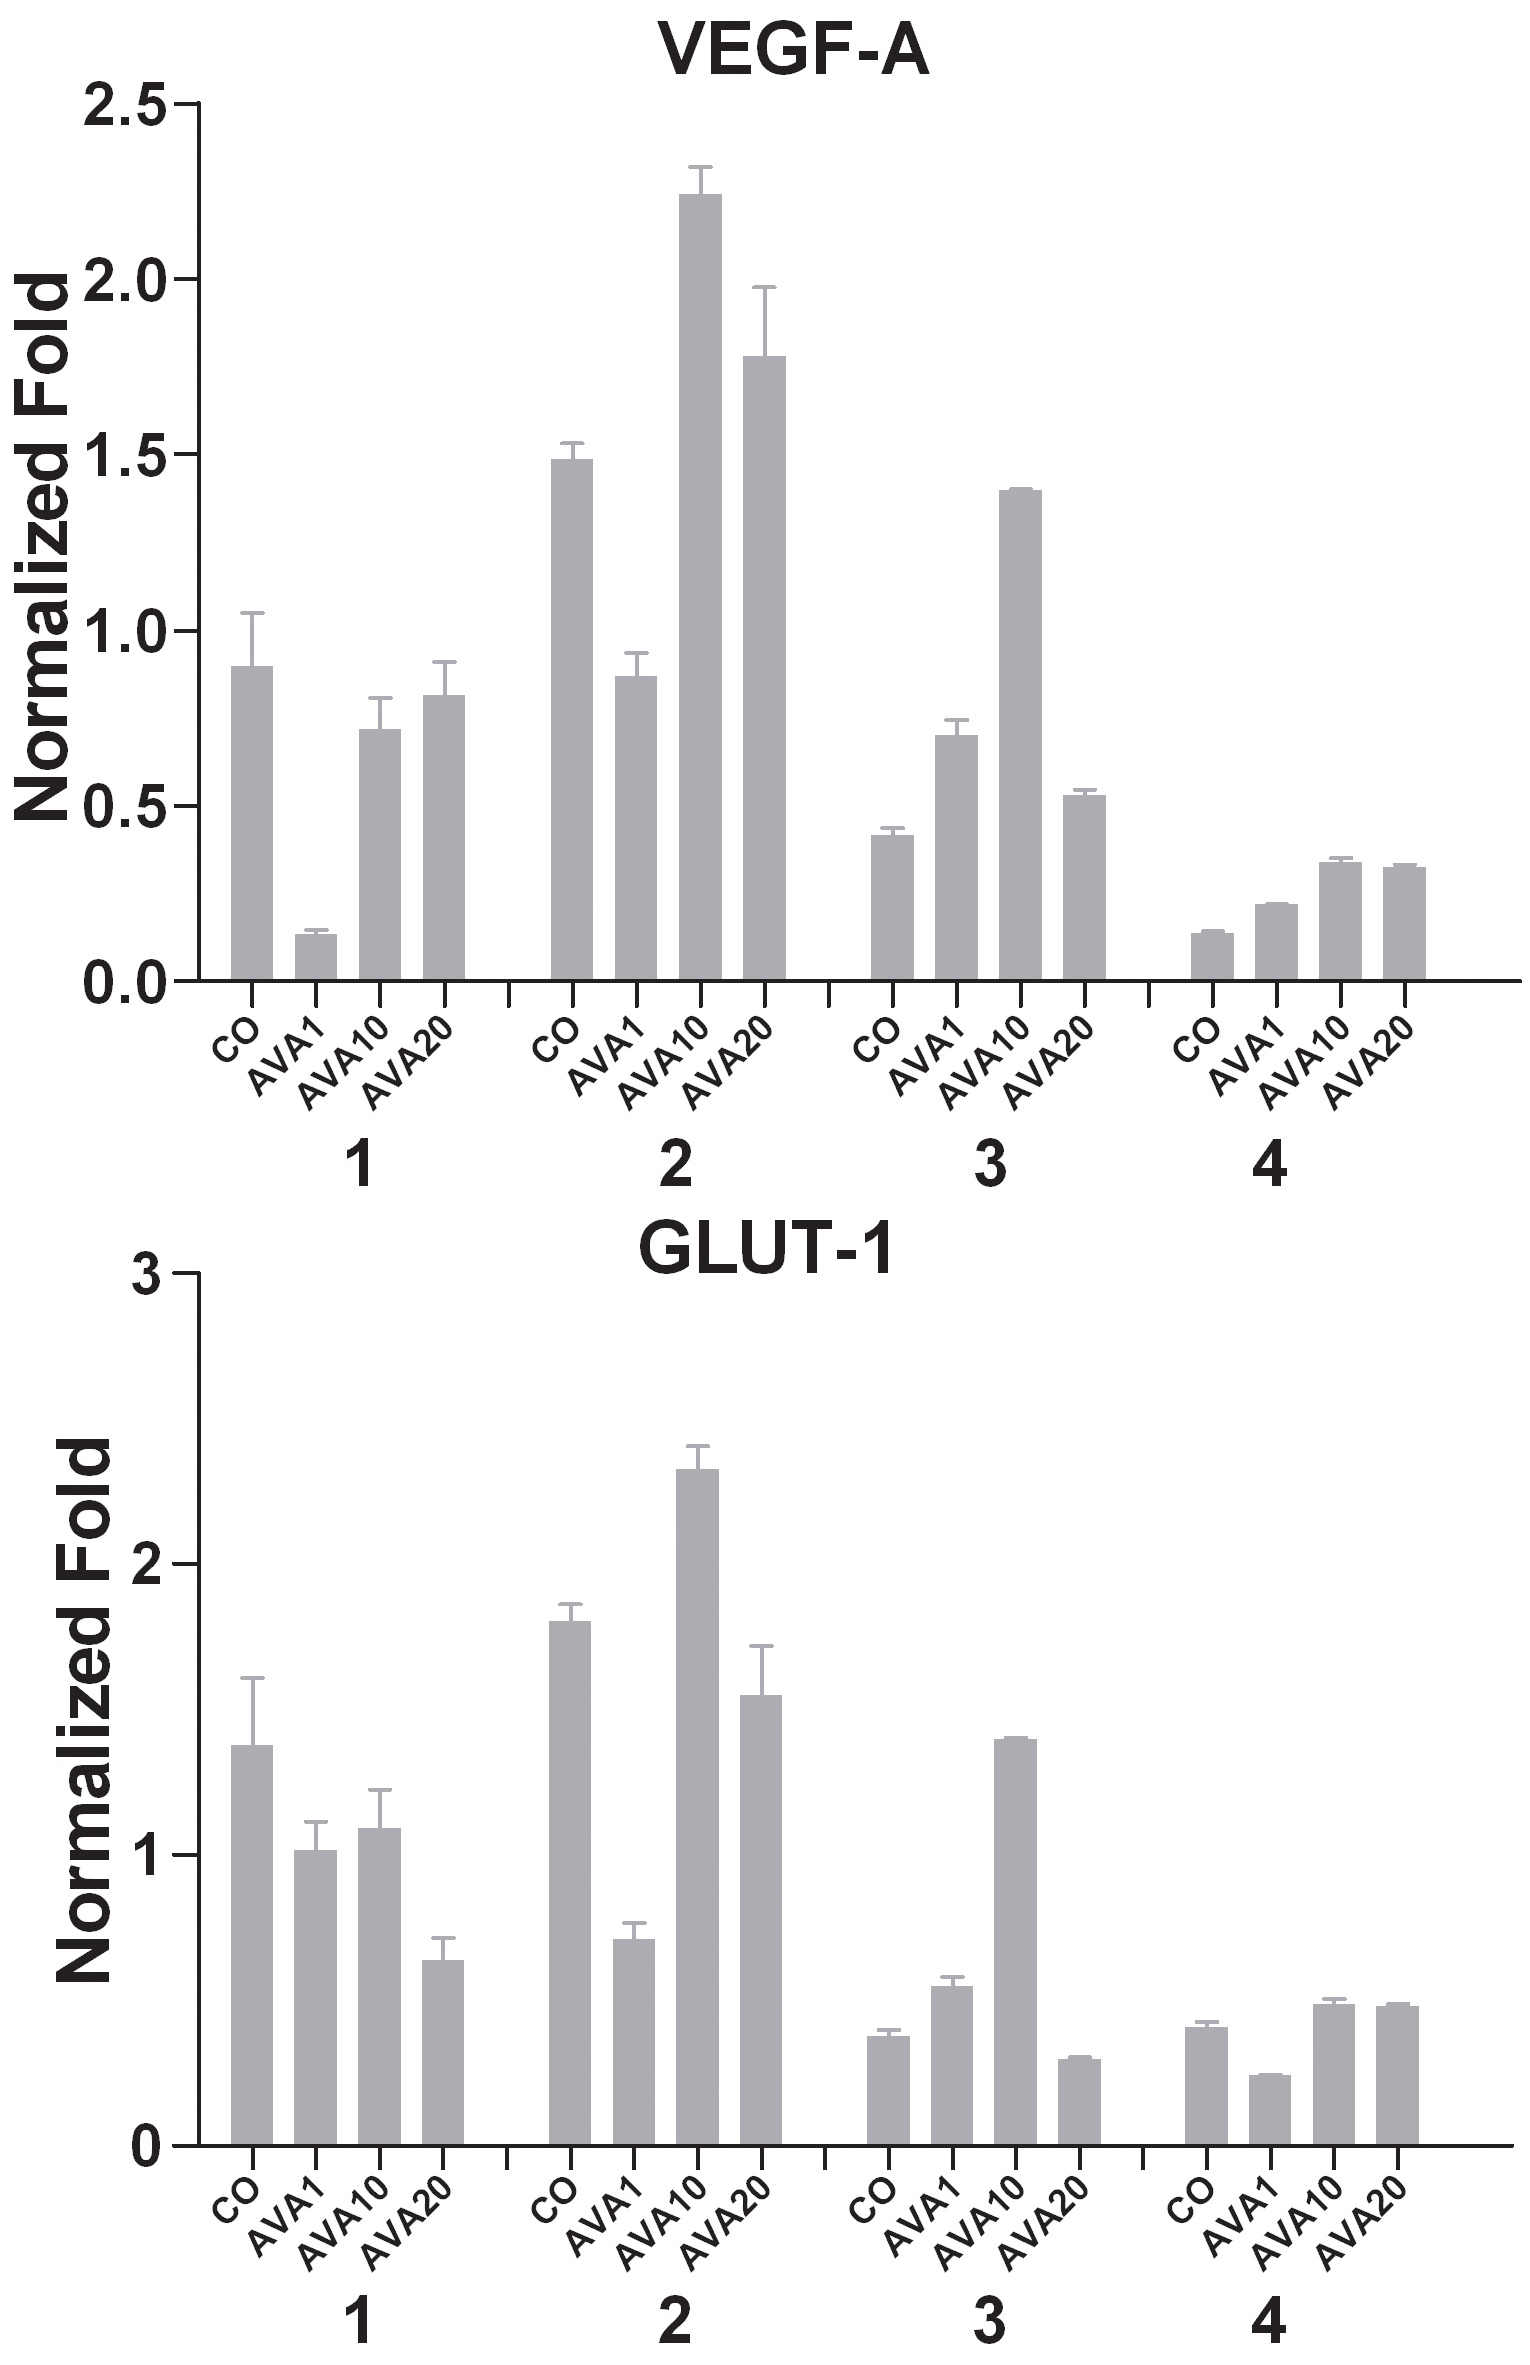
Figure 8. mRNA expression of UM cell
cultures after bevacizumab treatment under hypoxic conditions.
mRNA expression was measured with qPCR under hypoxic conditions
and after 24 h of different doses bevacizumab treatment.
Expression is demonstrated in normalized fold. Two cell cultures
show a clear induction of VEGF-A expression after treatment with
bevacizumab (culture two and three). GLUT-1 expression in UM
cell cultures corresponds to the VEGF-A expression (bottom);
correlation coefficient 0.974, p=0.0002. AVA1=equivalent human
dose: 1.25 mg/ 5.46 ml; AVA10=10 times the equivalent human
dose: 12.5 mg/ 5.46 ml; AVA20=20 times the equivalent human
dose: 25 mg/ 5.46 ml; CO=control group: culture medium.

 Figure 8
of el Filali, Mol Vis 2012; 18:2454-2467.
  Figure 8
of el Filali, Mol Vis 2012; 18:2454-2467.