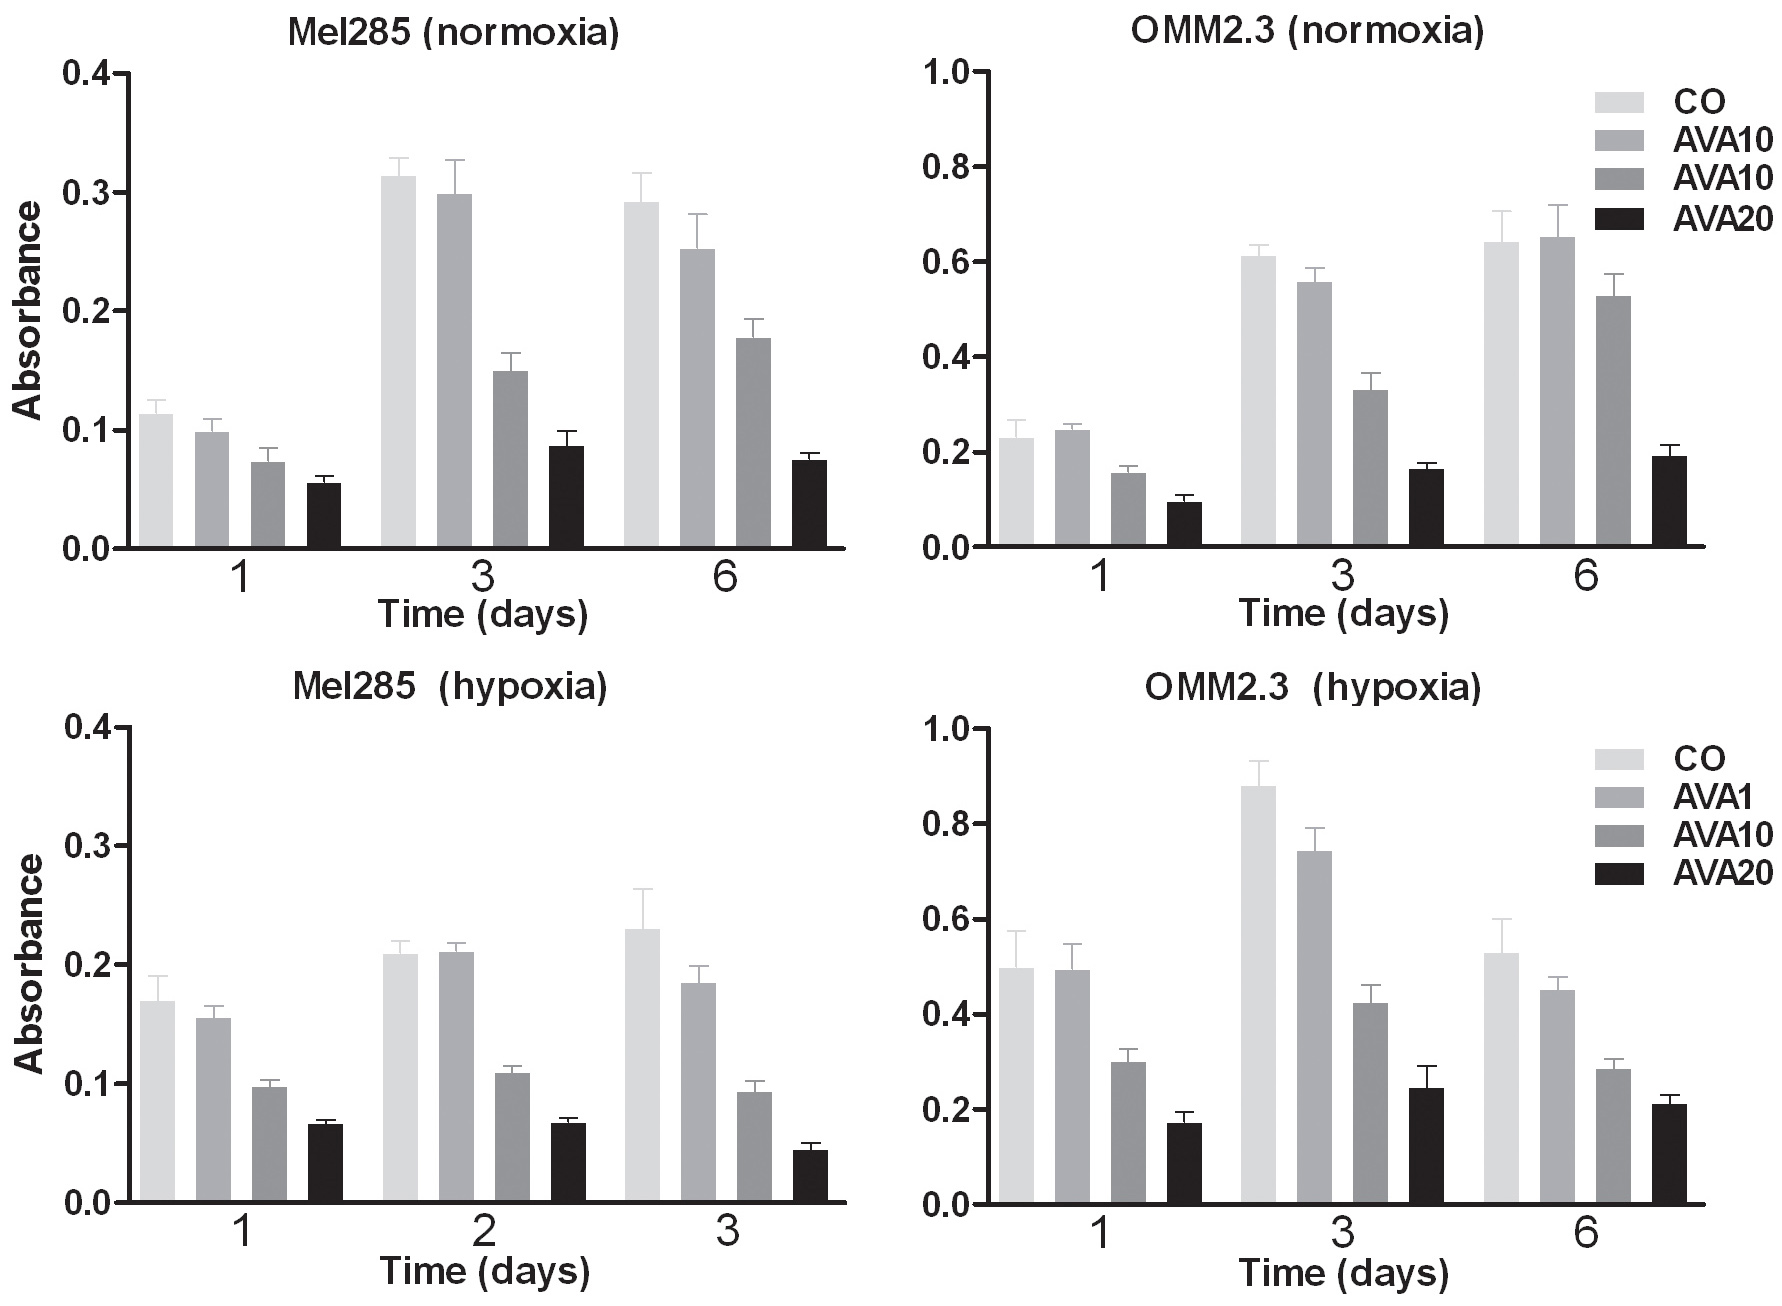
Figure 6. Proliferation of UM cell
lines after bevacizumab treatment. Proliferation of UM cell
lines was measured by WST-1 assay after exposure to three
different doses of bevacizumab during one, three or six days,
under normoxic and hypoxic conditions. Cell density is expressed
as absorbance (optical density, OD). A dose-dependent decrease
of proliferation after treatment with bevacizumab occurs under
hypoxic as well as normoxic conditions. AVA1=equivalent human
dose: 1.25 mg/ 5.46 ml; AVA10=10 times the equivalent human
dose: 12.5 mg/ 5.46 ml; AVA20=20 times the equivalent human
dose: 25 mg/ 5.46 ml; CO=control group: culture medium.

 Figure 6
of el Filali, Mol Vis 2012; 18:2454-2467.
  Figure 6
of el Filali, Mol Vis 2012; 18:2454-2467.