Figure 4. VEGF-A expression of B16F10
cells after bevacizumab treatment The effect of bevacizumab on
VEGF-A expression in B16F10 cells was determined using qPCR
analysis (top) and ELISA (bottom). The amount of VEGF-A mRNA
expression was measured with qPCR under normoxic (black) and
hypoxic (gray) conditions after 24 h with different doses
bevacizumab treatment. Expression is demonstrated in normalized
fold. VEGF-A mRNA expression increased in a dose-dependent
manner after treatment with bevacizumab, when cells were
cultured under hypoxic conditions. An ELISA was used to measure
the amount of VEGF-A protein in the supernatant of UM cell lines
after hypoxic exposure for 24 h. Shown is the amount of VEGF-A
protein (pg/ml). Paradoxically, the amount of produced protein
is reduced in the presence of bevacizumab. AVA1=equivalent human
dose: 1.25 mg/5.46 ml; AVA10=10 times the equivalent human dose:
12.5 mg/ 5.46 ml; AVA20=20 times the equivalent human dose: 25
mg/5.46 ml; CO=control group: culture medium.
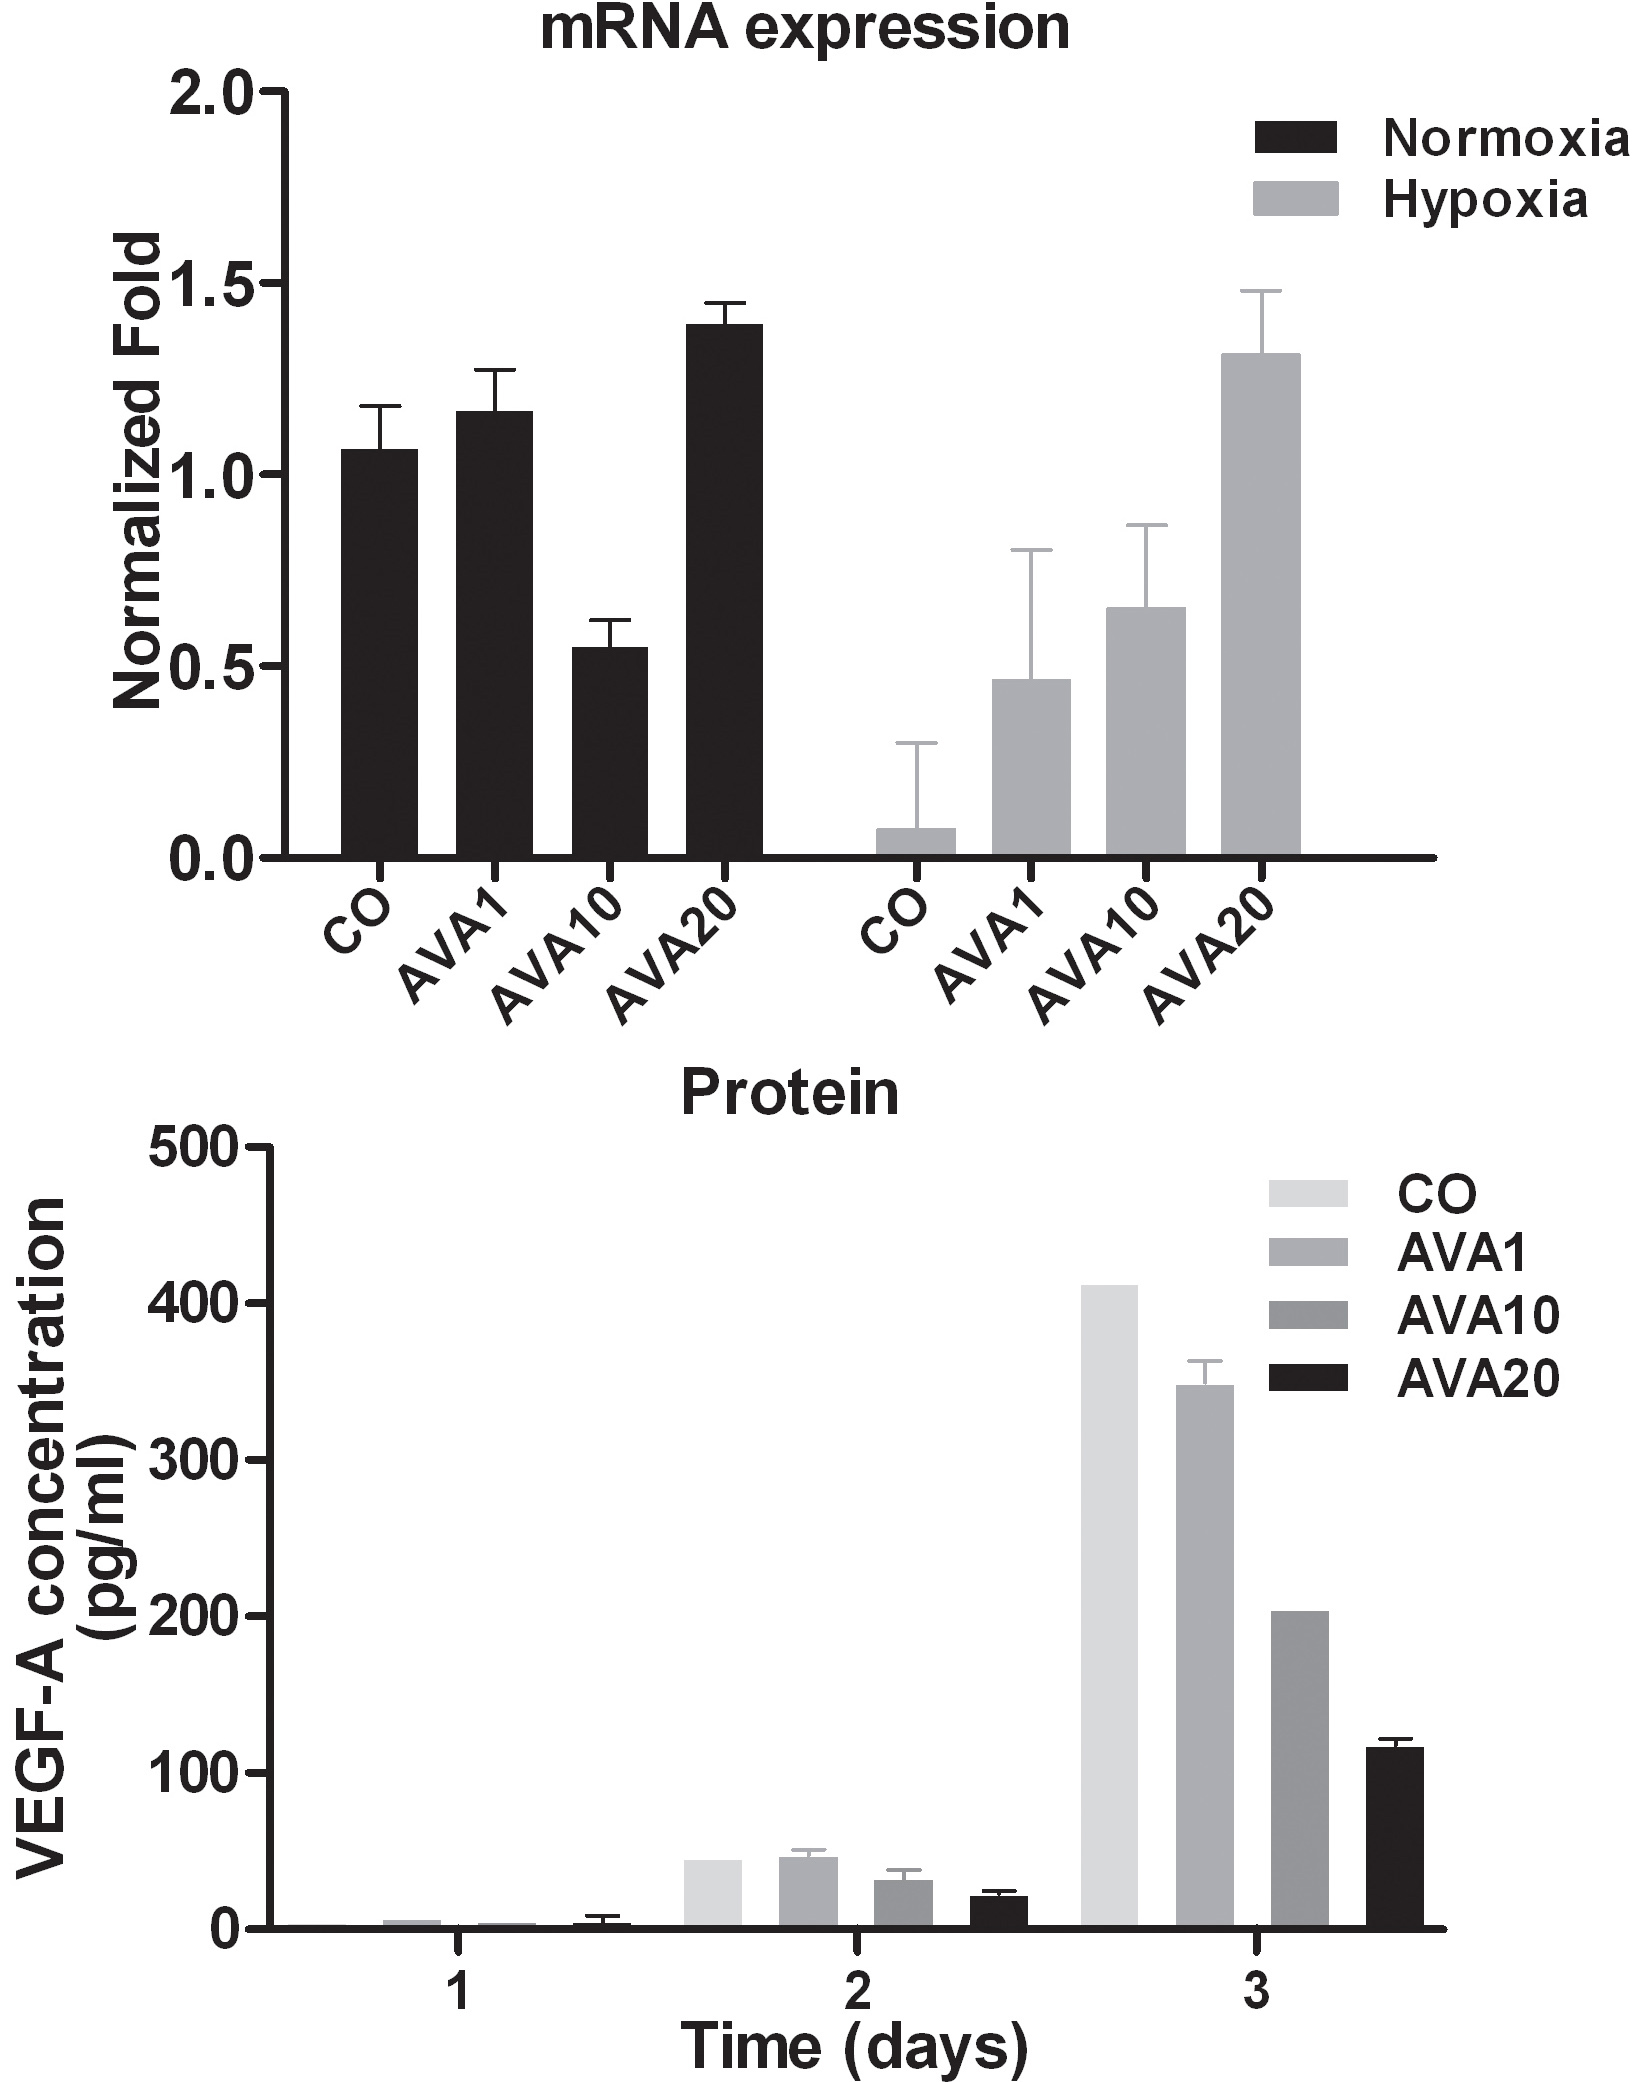
 Figure 4
of el Filali, Mol Vis 2012; 18:2454-2467.
Figure 4
of el Filali, Mol Vis 2012; 18:2454-2467.