Figure 7. The mRNA expression of selected genes from the microarray data was confirmed using real-time quantitative reverse-transcriptase
PCR. The black bars represent the mRNA levels quantified with qRT–PCR in the HMGA2-short interfering siRNA treated Y79 cells, and the spotted bars represent the fold expression of genes in the HMGA2-short interfering (siRNA) treated WERI Rb1 cells. The error bars represent the standard deviation of triplicate values. Abbreviations:
DRAM represents damage-regulated autophagy modulator, ELK1: member of ETS oncogene family, GTSE1: G-2 and S-phase expressed
1, CDK6: cyclin-dependent kinase 6, E2F4:E2F transcription factor 4, p107/p130-binding, CDH1: cadherin 1, type 1, E-cadherin
(epithelial; 1), SNAI1: snail homolog 1 (Drosophila), MMP2: matrix metallopeptidase 2, MMP 9: matrix metallopeptidase 9.
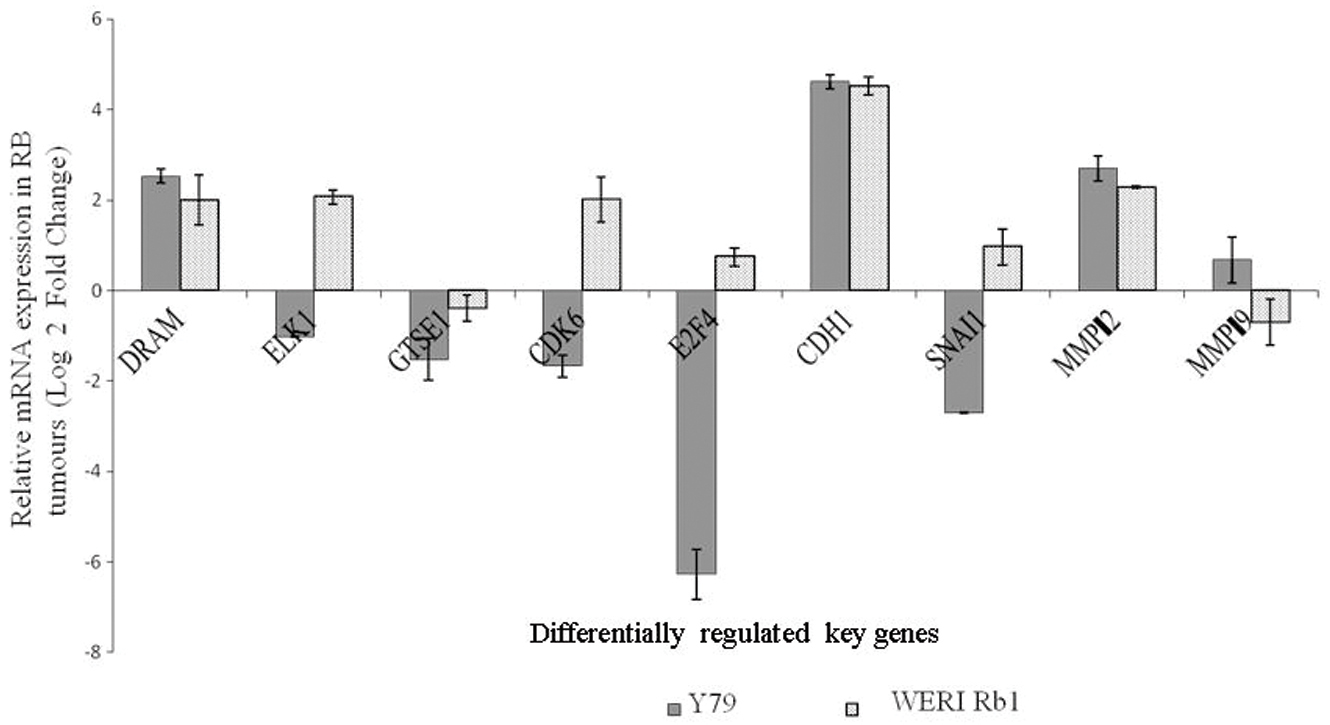
 Figure 7 of
Venkatesan, Mol Vis 2012; 18:2420-2437.
Figure 7 of
Venkatesan, Mol Vis 2012; 18:2420-2437.