Figure 3. HMGA2 short interfering RNA treatment results in the marked arrest of the cell cycle phase. A: Untreated Y79 cells. B: Scrambled siRNA treated Y79 cells. C: HMGA2 siRNA treated Y79 cells showing marked G:0/G:1 and S: phase cell cycle arrest compared to the control cells. D: Untreated WERI Rb1 cells. E: Scrambled siRNA treated WERI Rb1 cells. F: HMGA2 siRNA-treated WERI Rb1 cells show marked G:2/M phase cell cycle arrest compared to the control cells.
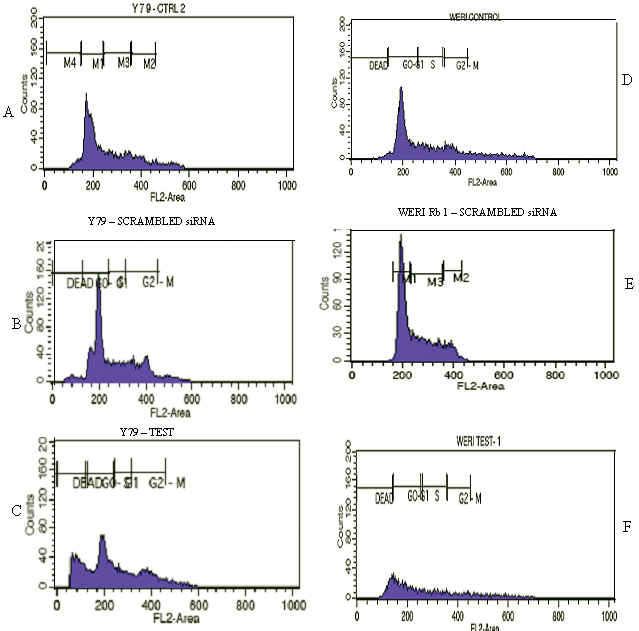
 Figure 3 of
Venkatesan, Mol Vis 2012; 18:2420-2437.
Figure 3 of
Venkatesan, Mol Vis 2012; 18:2420-2437.