Figure 4. Fundus photographs (A,
C: E, G: and spectral domain optical coherence tomography
images B: D, F: H-J: in retinitis pigmentosa
patients with missense mutations. In fundus images, areas of
atrophy along the arcades (A; red arrowheads) and marked
pigmentary changes E: were noted. In optical coherence
tomography (OCT) images, intraretinal cyst or cystoid macular
edema (CME; B: I; red arrow), severe foveal
atrophy D: H, J: and normal range of foveal
thickness F: were observed.
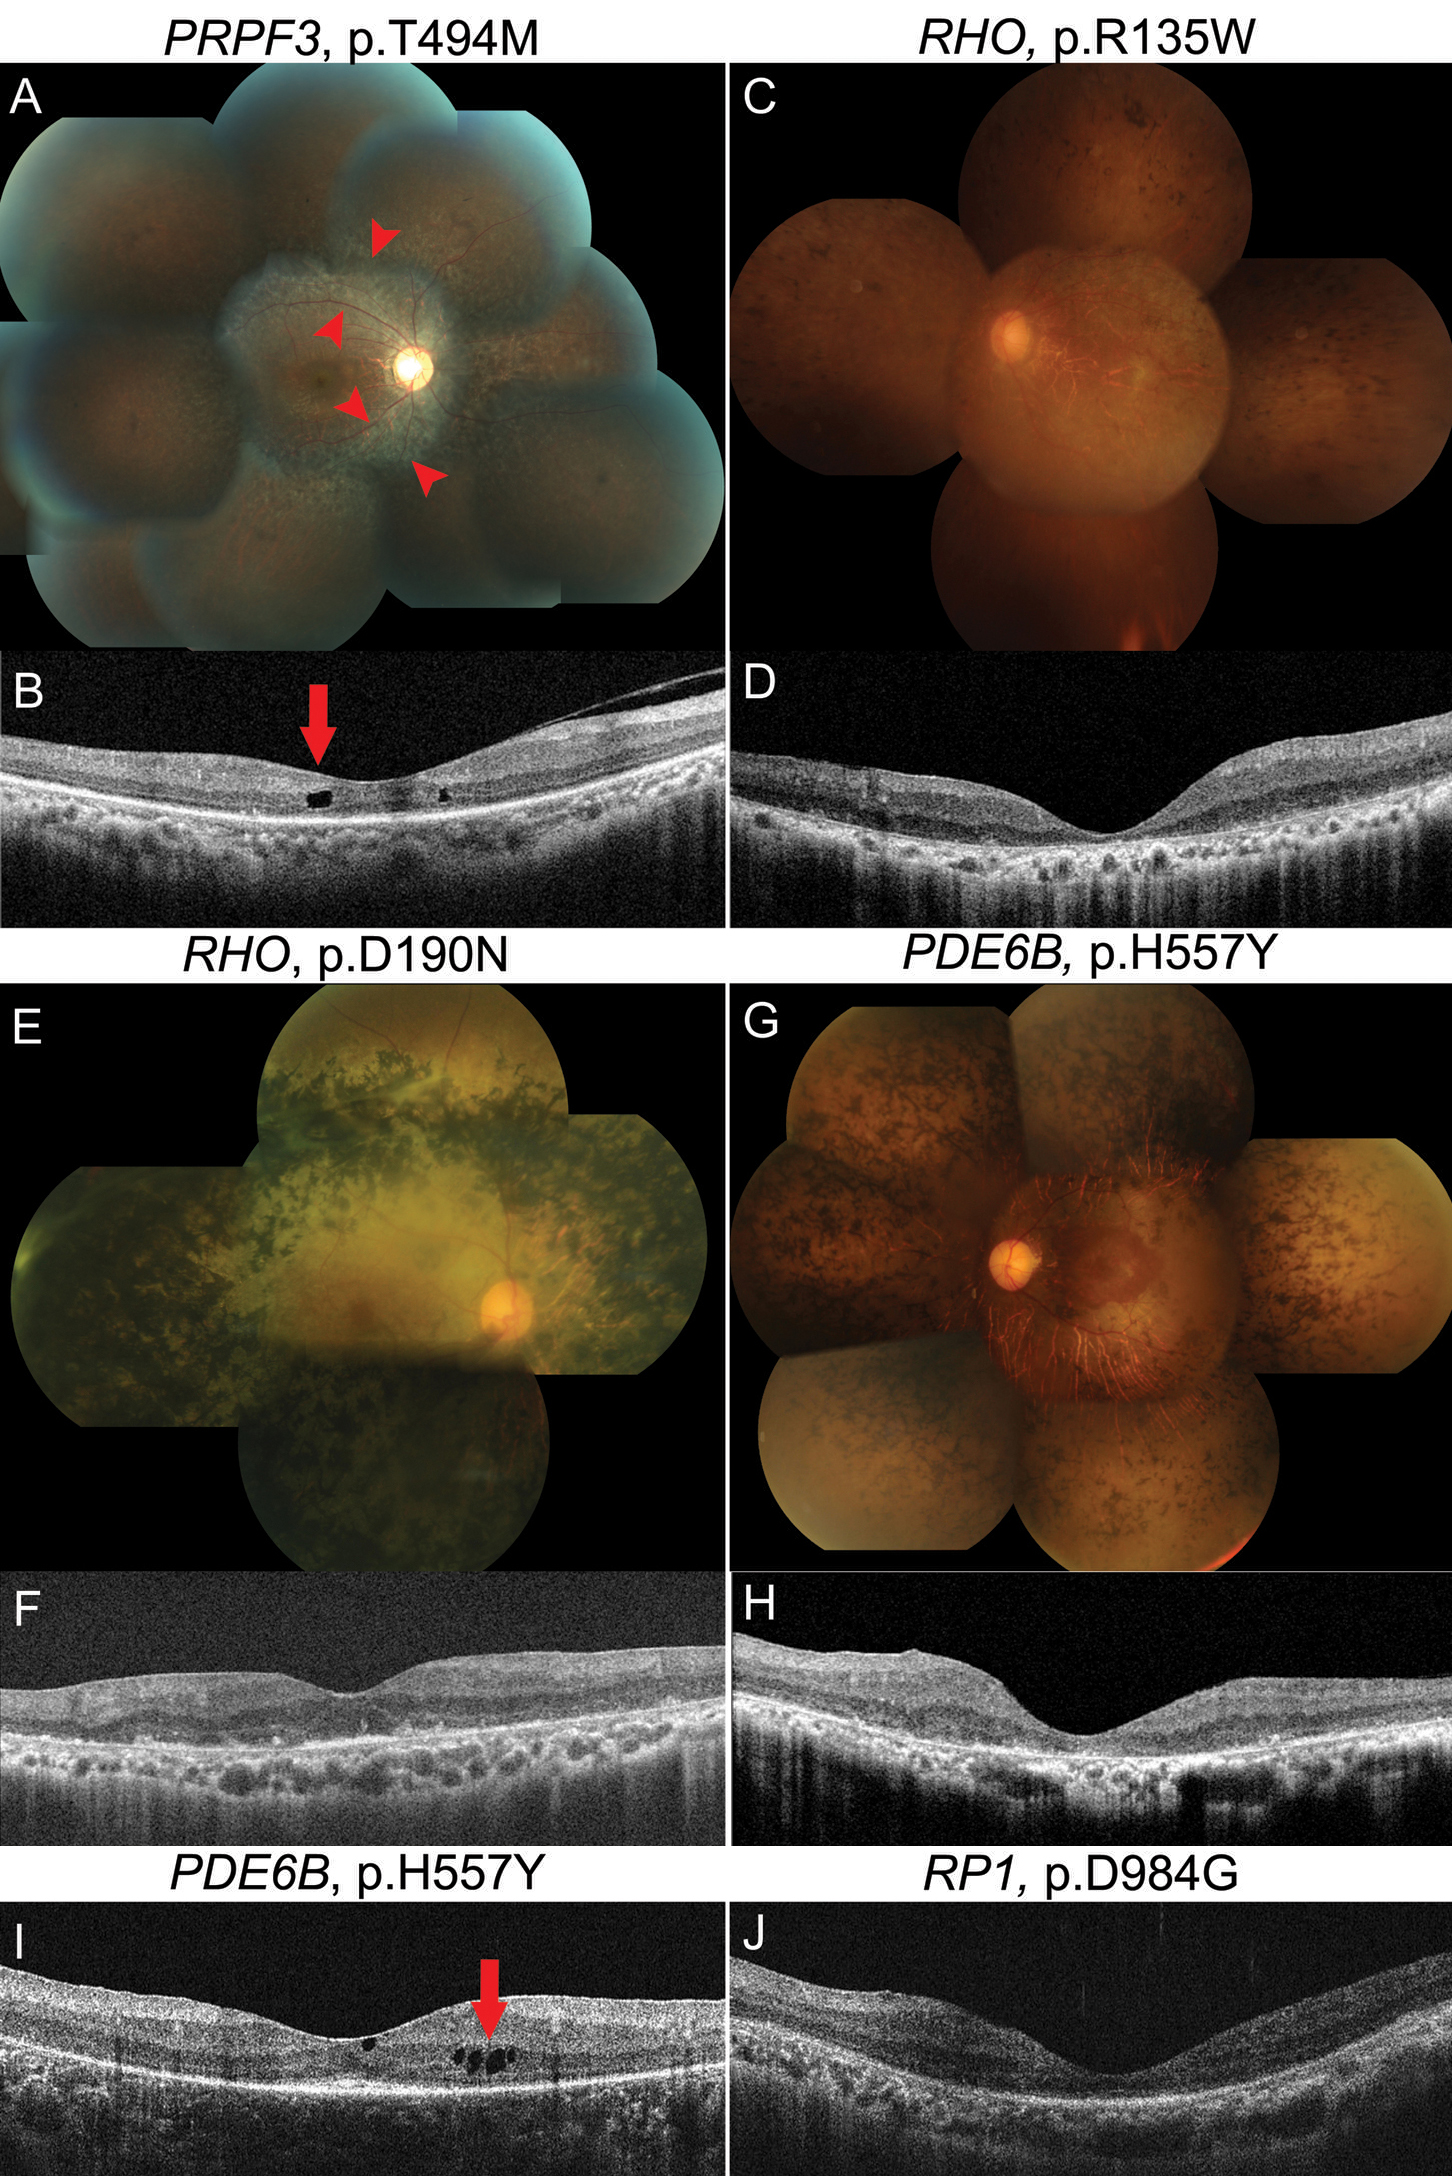
 Figure 4
of Kim, Mol Vis 2012; 18:2398-2410.
Figure 4
of Kim, Mol Vis 2012; 18:2398-2410.