Figure 2. Genotype inconsistency
between the GoldenGate assay (upper) and the sequence analysis
(lower). In the GoldenGate assay, colored dots represent
genotyped individuals (blue, a homozygote of reference allele;
red, a homozygote of mutated allele; purple, a heterozygote;
black, genotype fail).
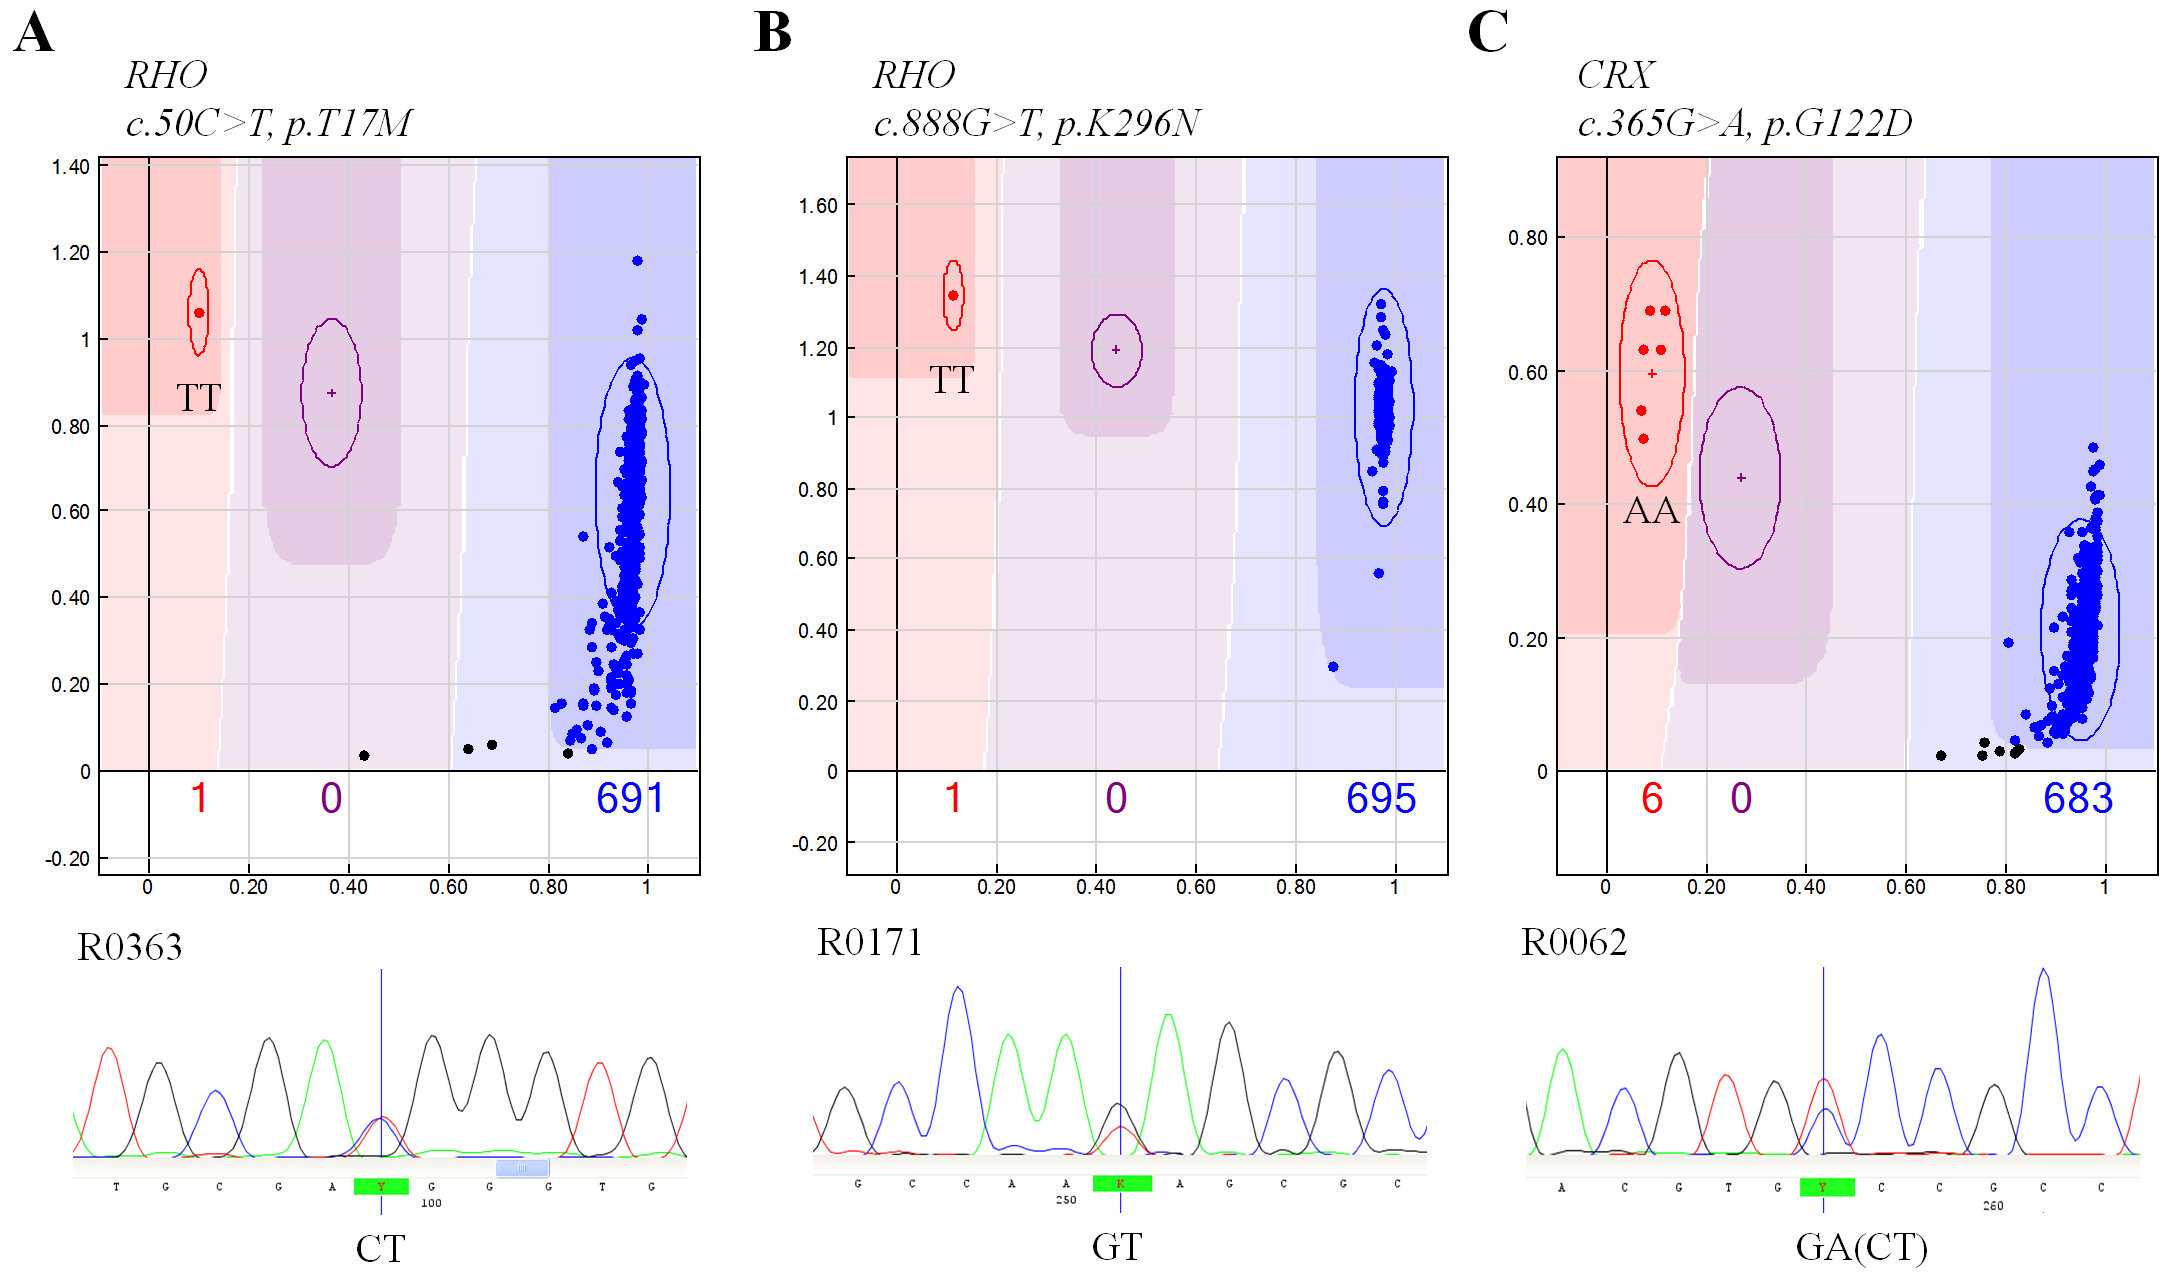
 Figure 2
of Kim, Mol Vis 2012; 18:2398-2410.
Figure 2
of Kim, Mol Vis 2012; 18:2398-2410.