Figure 3. Higher expression levels of CD133 protein and genes in stem-like cancer cells. A-B: The percentage of CD133+ cells was determined with flow cytometric analysis using a phycoerythrin-conjugated anti-CD133 antibody. CD133+ cells (in the Q4 area) comprised 69.77±1.39% of the total cell population in the WERI-Rb1 cell line (Figure A), whereas CD133+ cells comprised 99.03±0.15% in the stem-like cancer cells (SLCCs; B:; p<0.001 with the Student t test). C: Real-time PCR quantification of the CD133 gene showed 2.25±0.19-fold higher expression in the SLCCs (**p<0.01 with the Student t test). The graph shows the mean±SD (n=3).
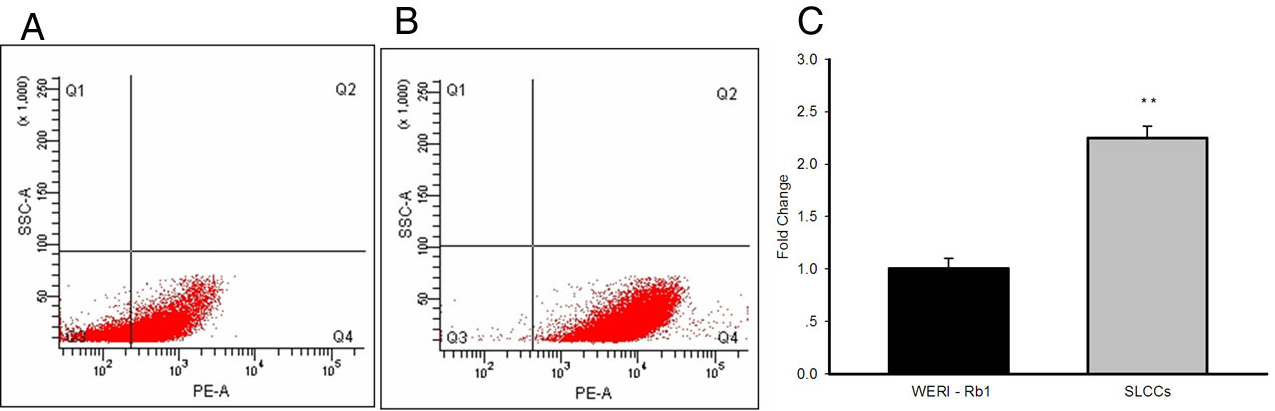
 Figure 3 of
Hu, Mol Vis 2012; 18:2388-2397.
Figure 3 of
Hu, Mol Vis 2012; 18:2388-2397.