Figure 3. Flow cytometry analysis for the levels of cell viability 6 h following laser irradiation using different powers based on annexin
V-fluorescein isothiocyanate and propidium iodide double staining. A: Representative flow cytogram. The percentage of cells in the Q3 region denotes viable cells, Q4: early apoptotic, Q1: necrotic,
and Q2: late apoptotic/necrotic cells. B: Graphical quantitation of the cell viability rates. The data represent mean ± standard error of the mean (SEM) of three
separate experiments (*p<0.05 versus control cells, Student t test). The results revealed that the laser injury threshold was at a laser power of 1,100 mW, above which there was significant
cell death.
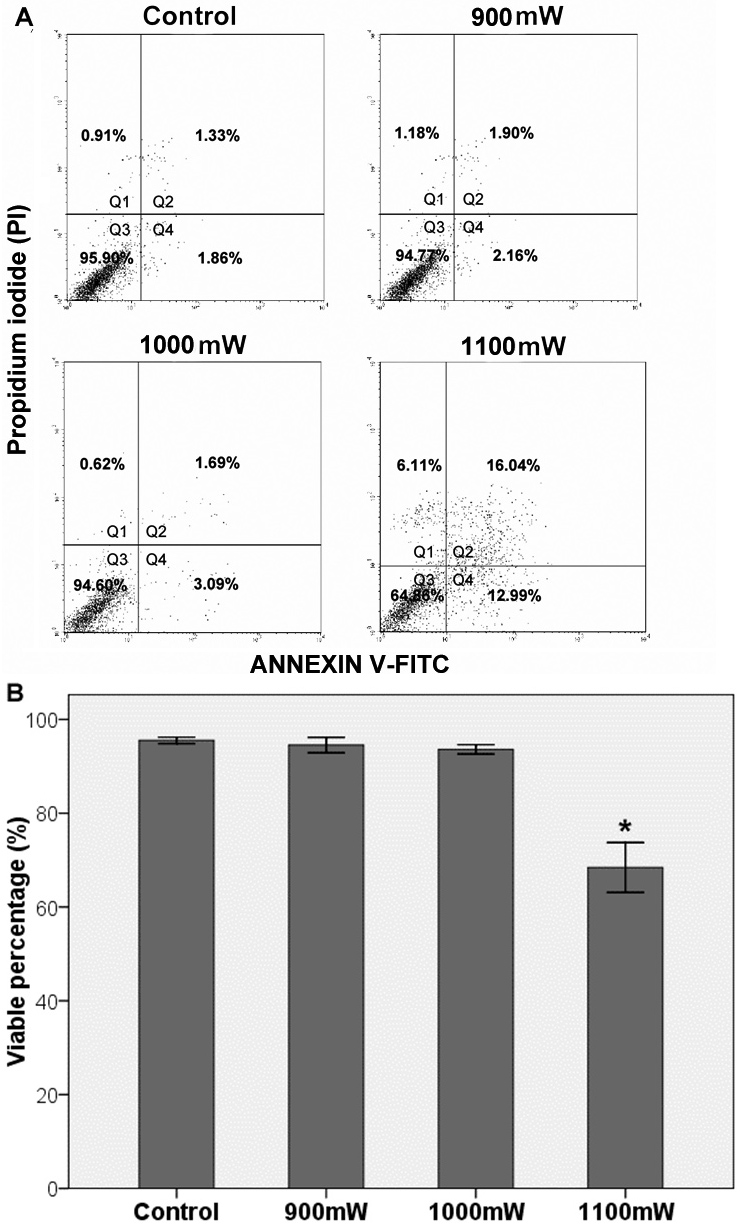
 Figure 3 of
Du, Mol Vis 2012; 18:2380-2387.
Figure 3 of
Du, Mol Vis 2012; 18:2380-2387.