Figure 5. Hyperglycemia evokes [Ca2+]i-dependent
and CaMKll-dependent mitochondrial membrane depolarization in
RF/6A cells. A-D: Analysis of mitochondrial
membrane potential (ΔΨm) in each treatment group. RF/6A cells
were treated for 96 h with A: 5.5 mM glucose (NG), B:
30 mM glucose (HG), C: HG plus either 2-APB, or D:
KN93, and ΔΨm was analyzed by JC-1 staining. Loss of ΔΨm was
demonstrated by the change in JC-1 fluorescence from red (JC-1
aggregates) to green (JC-1 monomers). E: The bar diagram
showed the ratio of JC-1 red fluorescence to green fluorescence
under each treatment condition. Data represented mean±SD of
three independent experiments. * p<0.05 versus NG; #
p<0.05 versus HG; # p<0.05 versus NG.
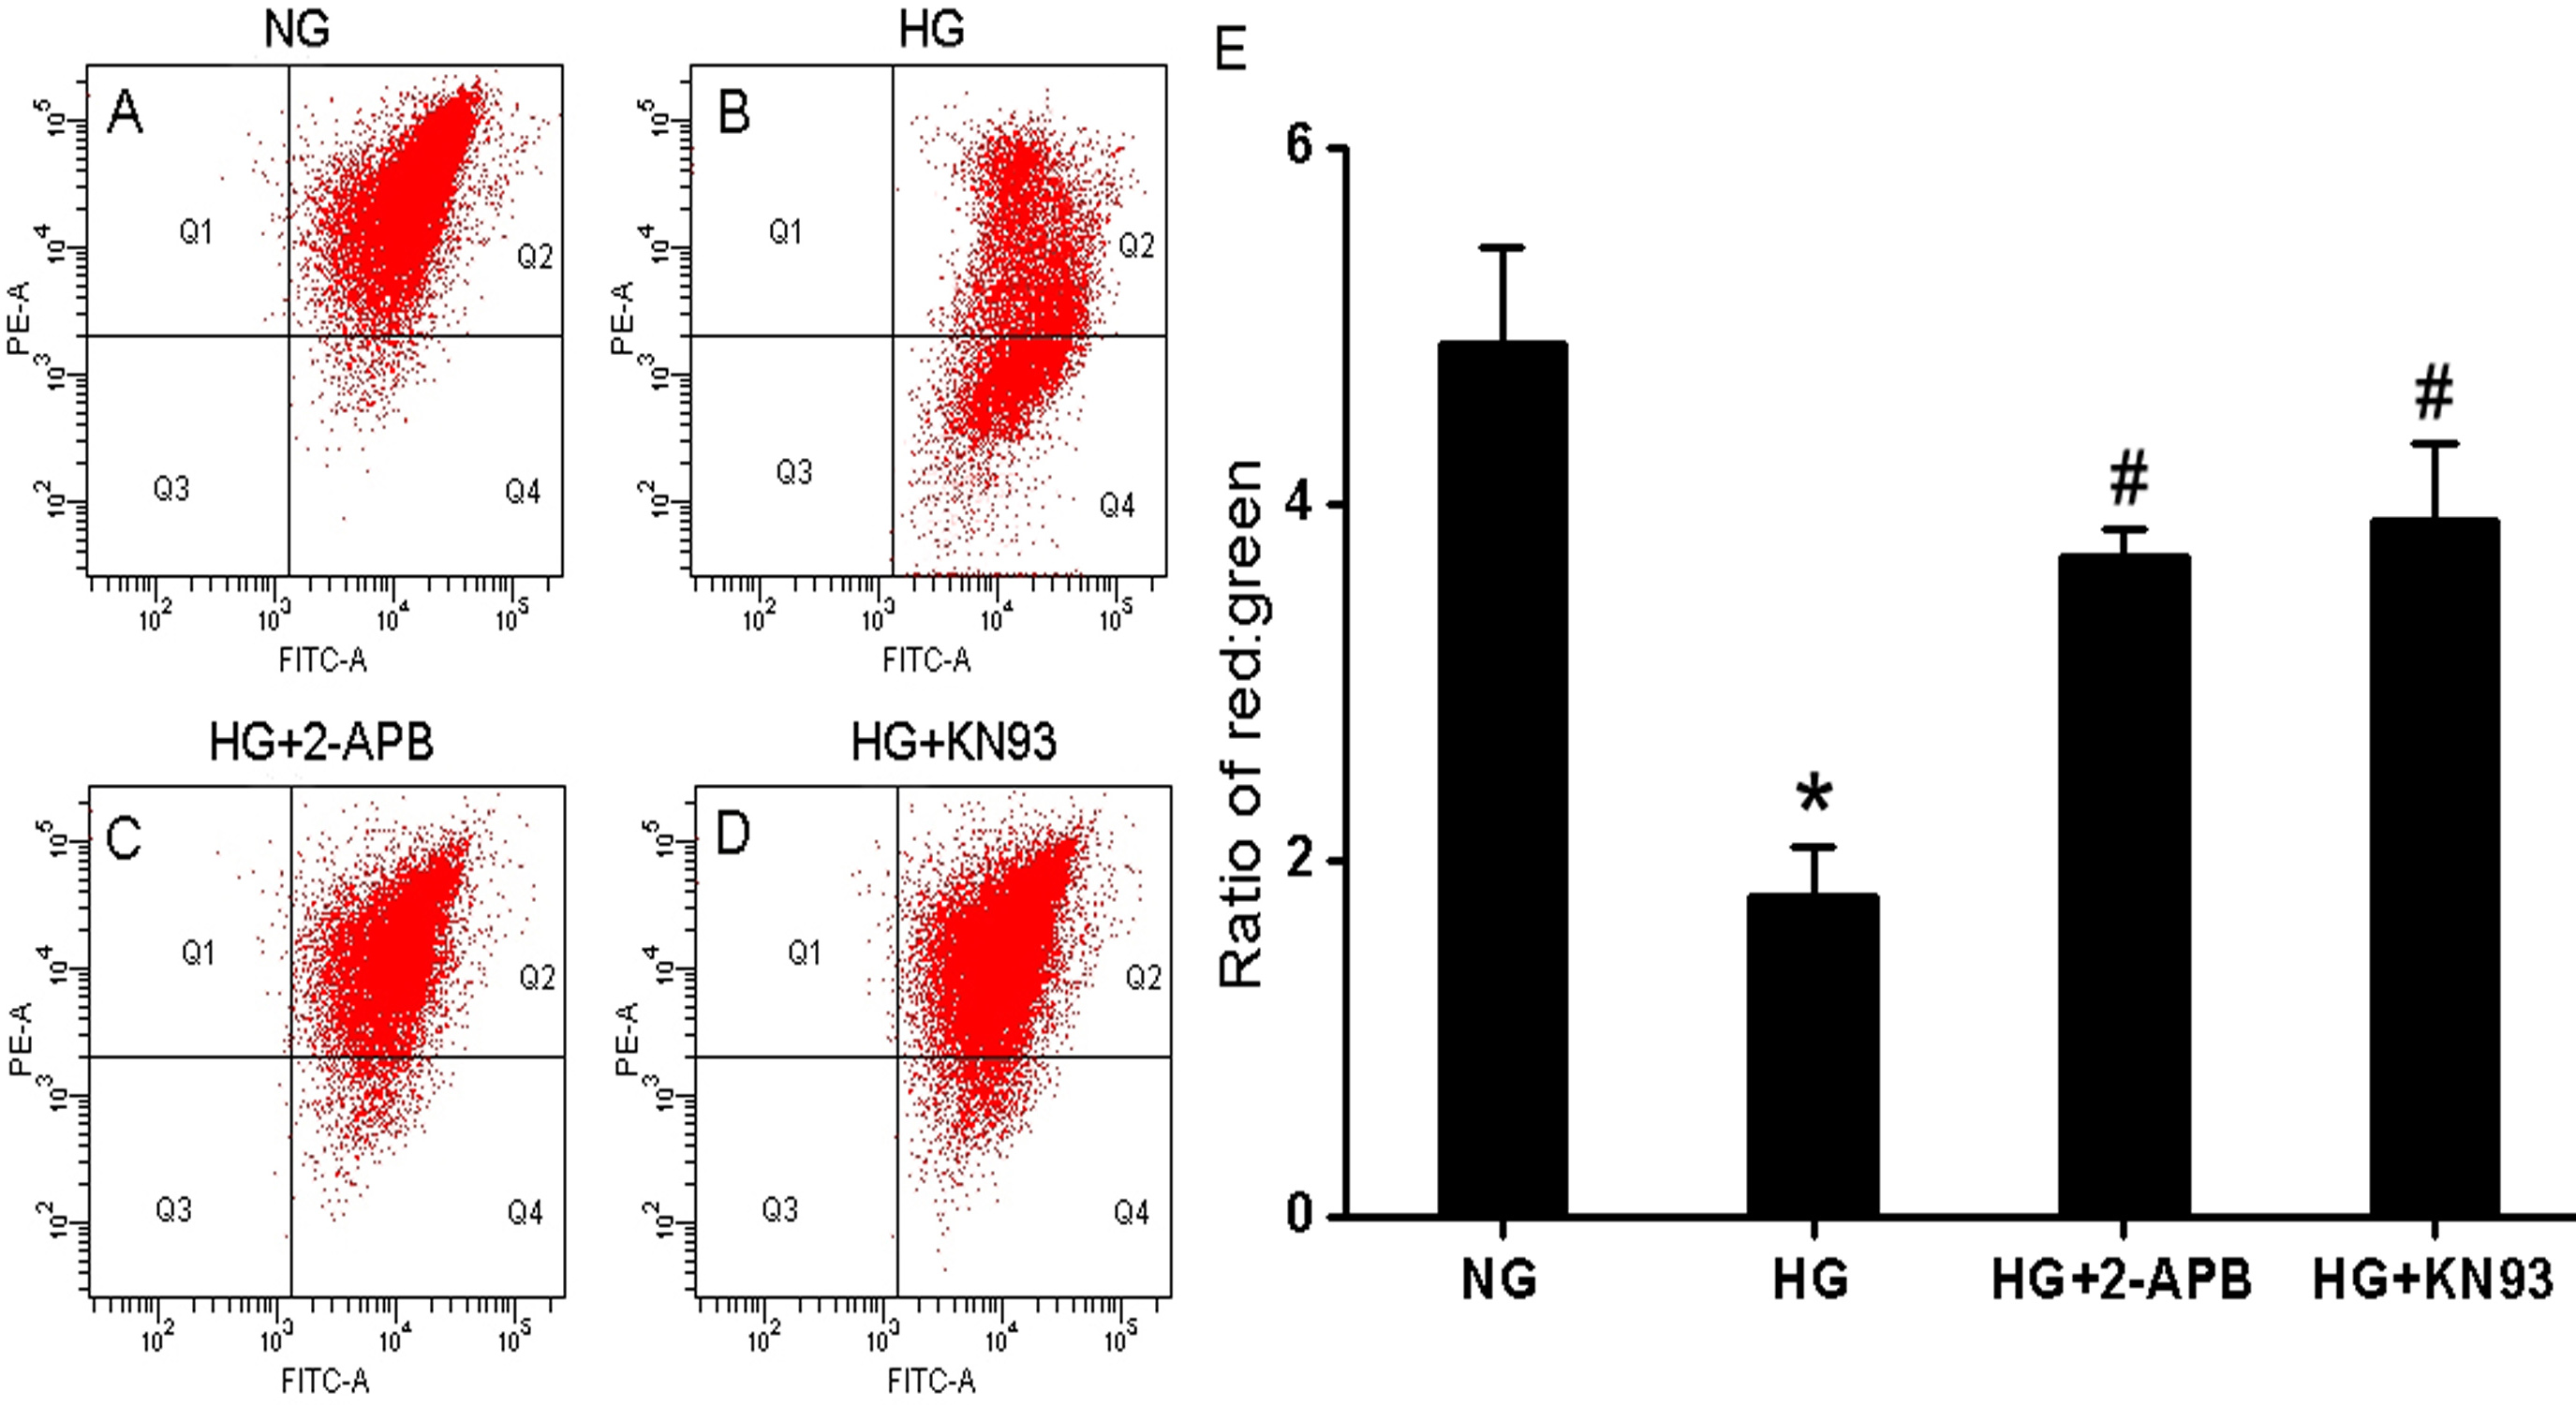
 Figure 5
of Li, Mol Vis 2012; 18:2371-2379.
Figure 5
of Li, Mol Vis 2012; 18:2371-2379.