Figure 2. Electroretinogram b-wave
changes after the injection of A: plasmin and SF6
(group 1), B: plasmin (group 2), or C: SF6
(group 3). The right eye of each rabbit in group 1 received a
pars plana injection of 1 unit of human plasmin and 0.5 ml of SF6.
The right eye of each rabbit in group 2 received an intravitreal
injection of 1 unit of human plasmin (0.1 ml) only. The right
eye of each rabbit in group 3 received an intravitreal injection
of 0.5 ml of SF6 only. The left eye of each animal in
these three groups received a 0.1 ml balanced salt solution
(BSS) injection. Electroretinogram (ERG) data showed a transient
decrease in the b-wave amplitude within one week after the
injections in groups 1, 2, and 3. But the decrease did not reach
statistical significance (p value=0.109, 0.285, 0.109 from group
1 to 3 [day 1]; p=0.285, 0.285, 0.593 from group 1 to 3 [day 3];
p=0.593, 0.285, 0.593 from group 1 to 3 [day 7]).Each group
consisted of three animals. Data were expressed as mean±SD. One
week after the injections, the amplitude returned to baseline.
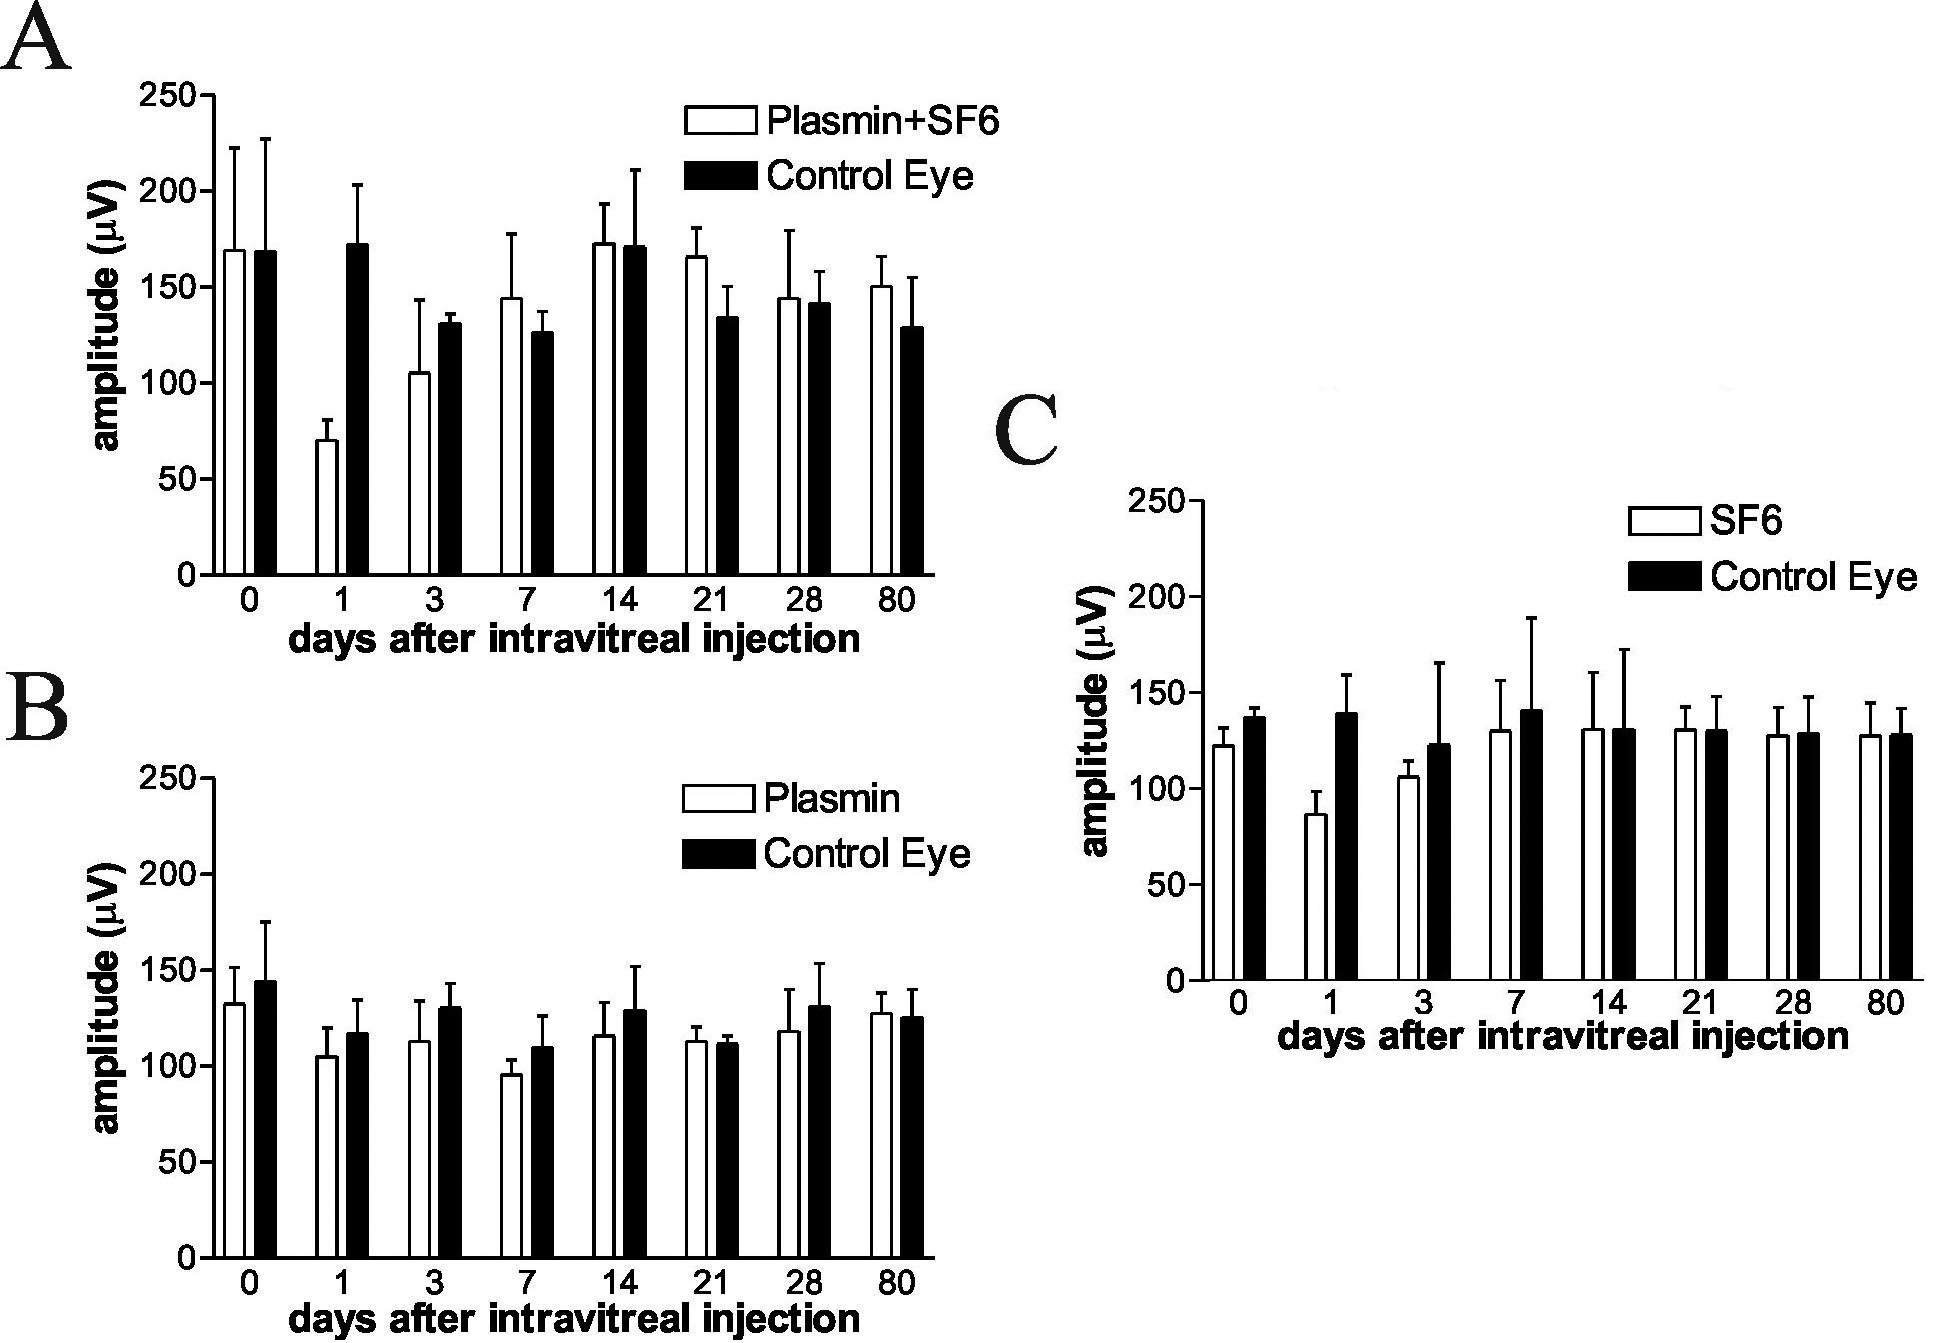
 Figure 2
of Wu, Mol Vis 2012; 18:2361-2370.
Figure 2
of Wu, Mol Vis 2012; 18:2361-2370.