Figure 2. Differentially regulated transcript counts in the mouse retina after the feeding trial. C57BL/6J mice fed with normal control
diet (NCD), high-fat diet (HFD) and 5% bilberries (BB) in these diets for 12 weeks. Counts from HFD up- and downregulated
probes (genes) with opposite ≥1.3 fold changes (a cut-off value equal to 0.4 in the log ratio) when compared to bilberry regulated
probes - HFD+BB versus HFD or NCD+BB versus NCD (Σ, the sum and gene count in brackets, * Includes the group of crystallins).
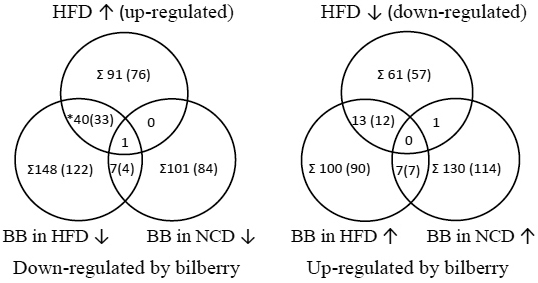
 Figure 2 of
Mykkänen, Mol Vis 2012; 18:2338-2351.
Figure 2 of
Mykkänen, Mol Vis 2012; 18:2338-2351.