Figure 5. The optokinetic response is
normal in both cdh23tc317e and cdh23tj264a
mutants. Graphs show the averaged slow-phase velocity of both
eyes measured under varying contrast (A) and spatial
frequency (B) of the optokinetic stimulation. No
significant difference was found between any of the groups
(repeated measures ANOVA; contrast: F3,32=0.525,
p=0.668; spatial frequency: F3,32=0.549, p=0.653; n=9
larvae per group).
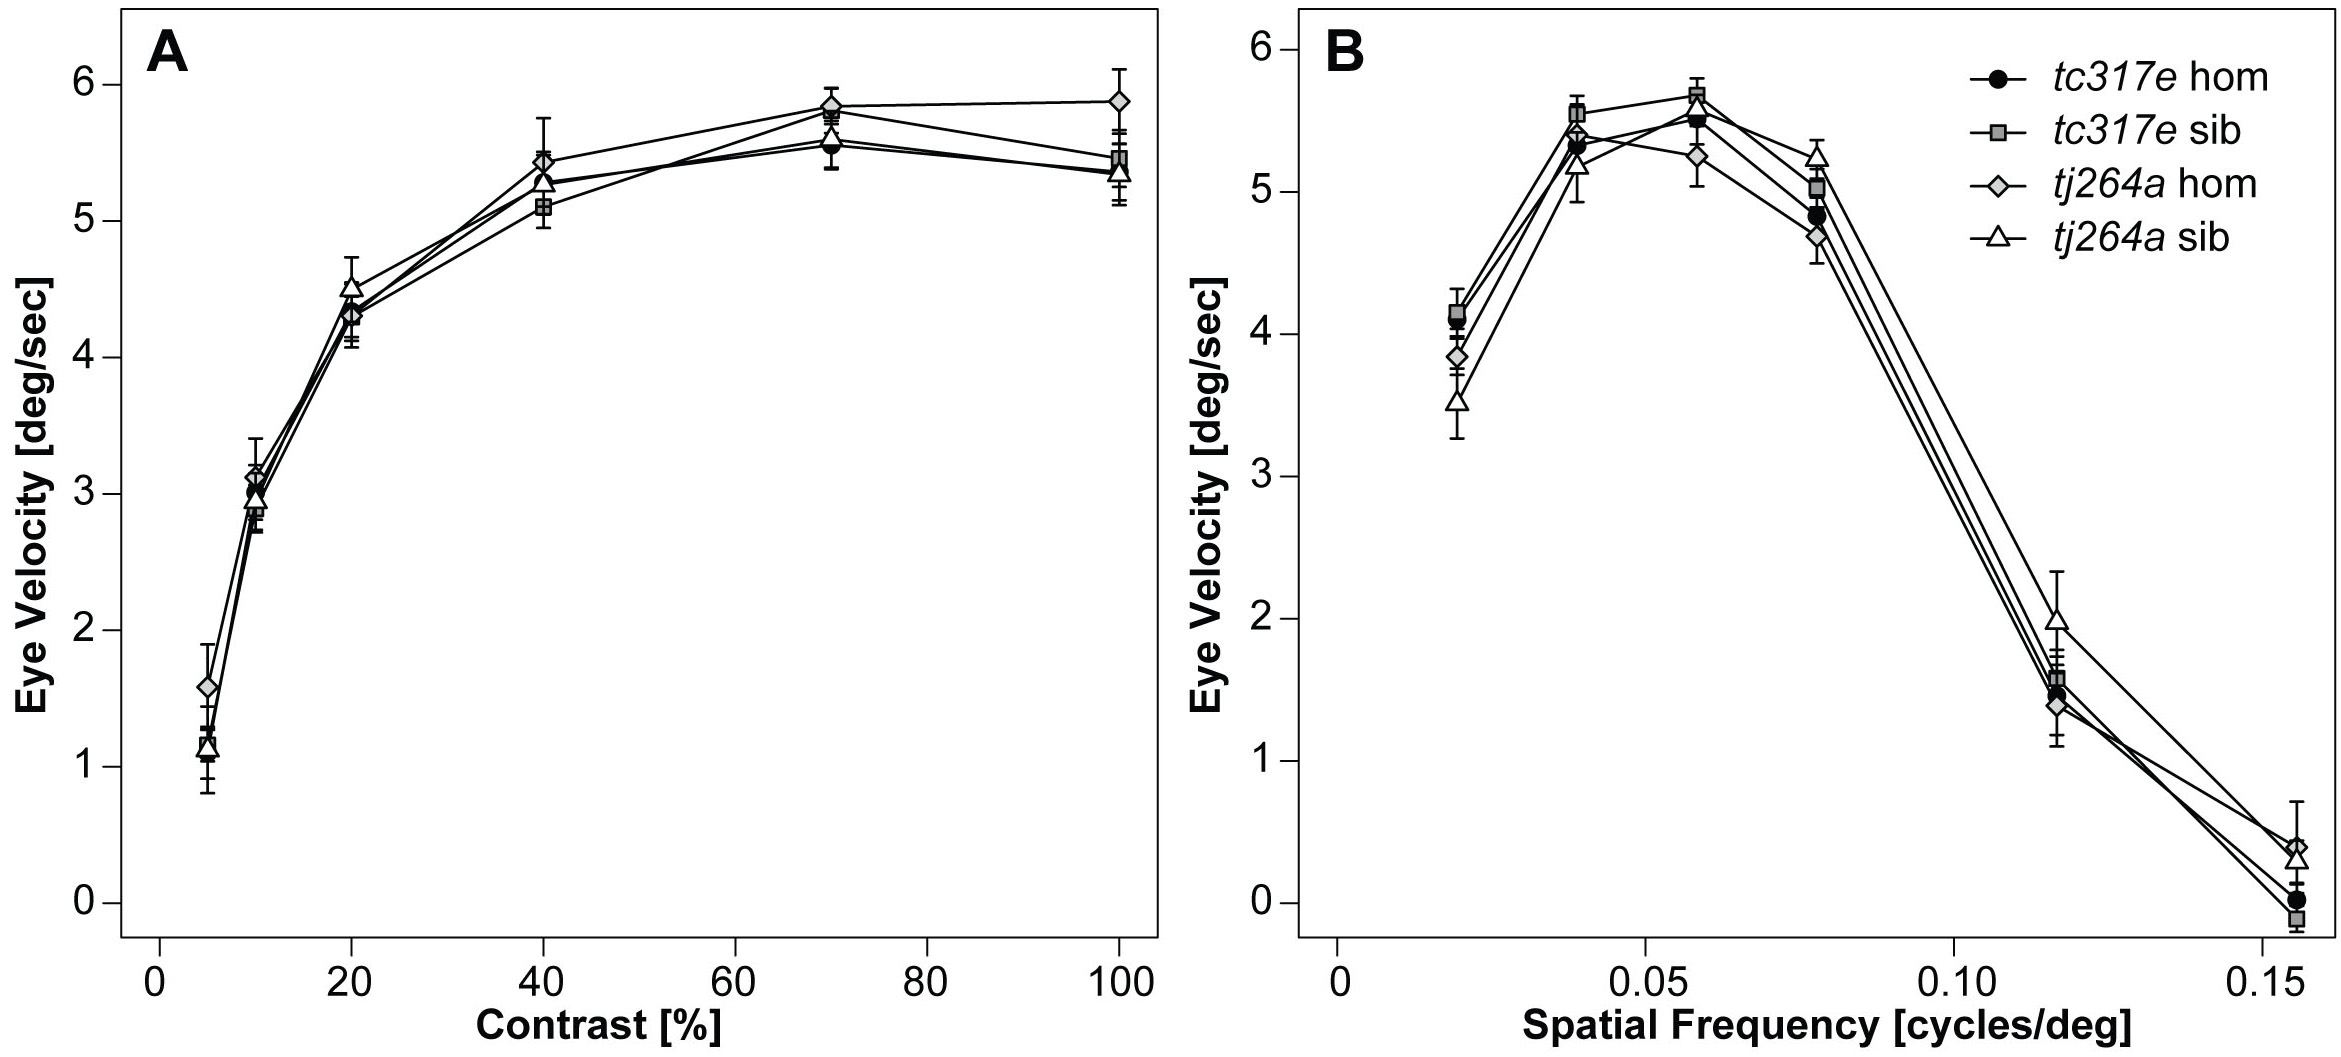
 Figure 5
of Glover, Mol Vis 2012; 18:2309-2322.
Figure 5
of Glover, Mol Vis 2012; 18:2309-2322.