Figure 5. Study of tyrosine kinase
activity in RPE cells with confocal microscopy. For each pair of
confocal images, the left panel shows the phosphotyrosine
signals, and the right panel shows the overlay of protein,
cytoskeleton, and nuclear stains (A) control RPE cells
without any treatment, (B) treatment with nano chitosan
(10 μM) for 5 h had no effect on tyrosine kinase expression,
similar to the control, (C) peptide conjugated with nano
chitosan (10 μM) increased the expression of tyrosine kinase
proteins, (D) pretreatment for 1 h with tyrosine kinase
blocker [Lavendustin-A (50 μM)] clearly suppressed protein
expression, (E) incubation with peptide (10 μM) alone had
no effect on the protein. Green: anti-phosphotyrosine antibody
(Alexa Fluor 488); red: actin cytoskeleton (rhodamine-phalloidin
stain); blue: nucleus (DAPI), (F) quantification of
tyrosine kinase signals under different treatment conditions as
described for A to E above.
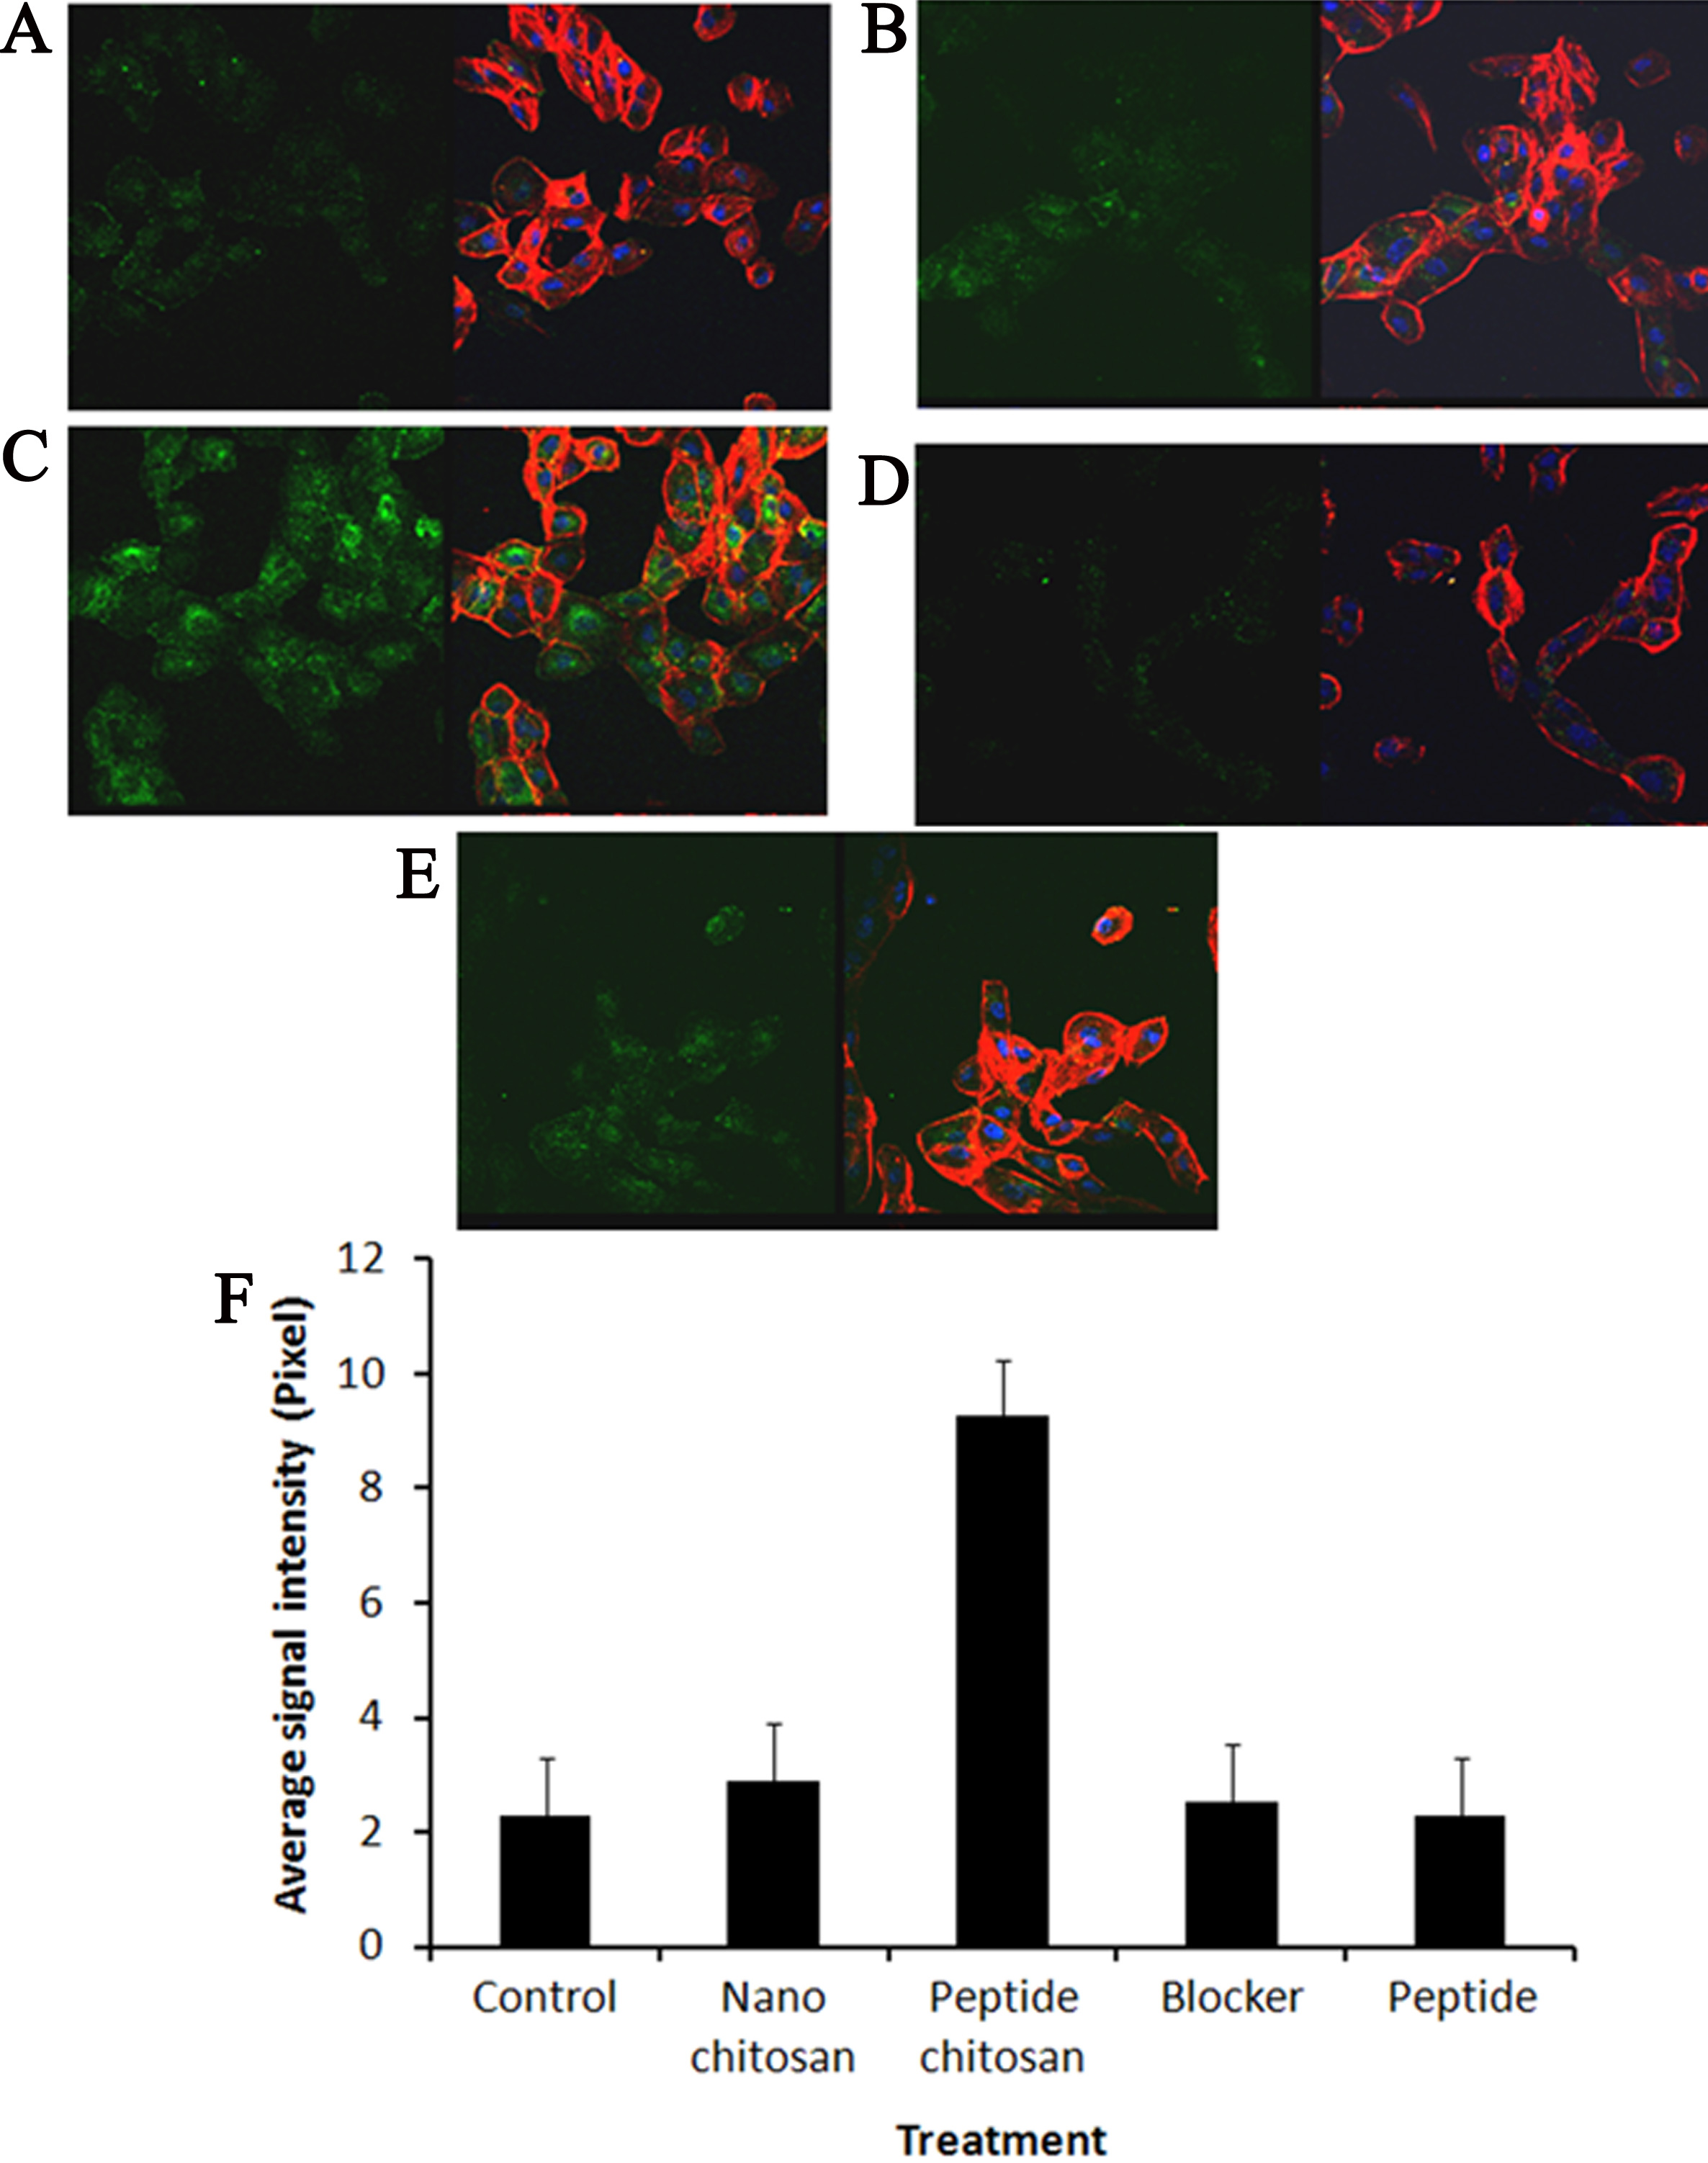
 Figure 5
of Jayaraman, Mol Vis 2012; 18:2300-2308.
Figure 5
of Jayaraman, Mol Vis 2012; 18:2300-2308.