Figure 4. Effect of antagomirs on miR 17–92 cluster, cell viability and cellular invasion. A: The bar diagram shows the expression of miR 17–92 cluster in Y79 cells treated with specific antagomirs. There is a significant
down-regulation of miR 17–92 clusters when treated with antagomirs. B: MTT assay graph showing the Y79 cell viability after 48 h of treatment with individual and mix antagomirs. There is a significant
decrease in cell viability when treated with antagomirs-17 (*p<0.01), antagomirs-19b (*p<0.01) and antagomirs mix (*p<0.001).
C: shows the effect of antagomirs (17–92) on Y79 cellular invasion process as analyzed by Matrigel invasion assay. There is
a significant decrease in cell invasion when treated with antagomirs-19b (*p<0.05) and antagomirs mix (**p<0.001)
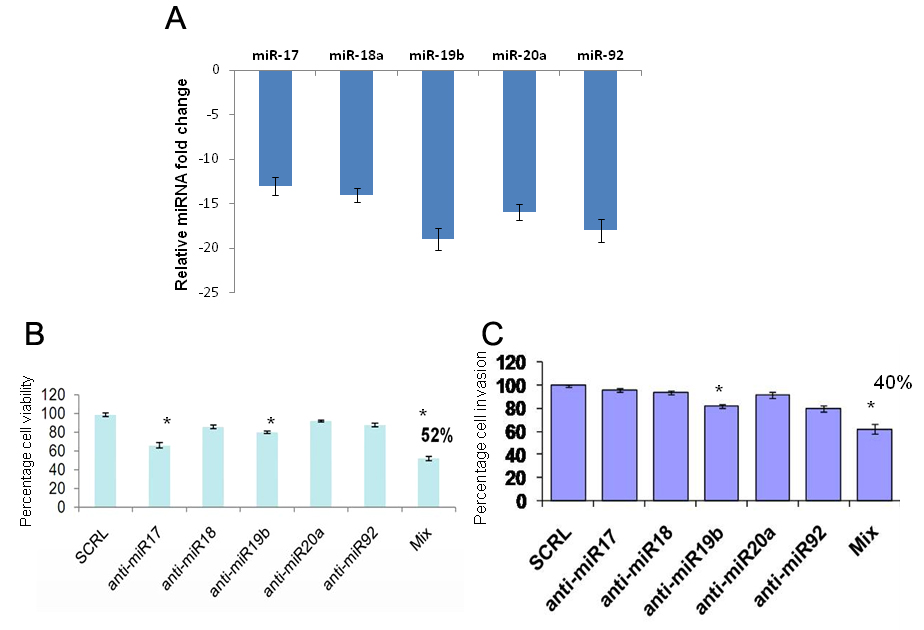
 Figure 4 of
Kandalam, Mol Vis 2012; 18:2279-2287.
Figure 4 of
Kandalam, Mol Vis 2012; 18:2279-2287.