Figure 2. Correlation between miR-18a and EpCAM expression in RB tumors. A: A bar diagram showing the expression of EpCAM in retinoblastoma (RB) tumor samples. The expression ranged from 12-fold to
200 fold compared to normal control retina samples. B: The plot showing the correlation between EpCAM and miR-18a in primary RB tumors. The correlation R value is equal to 0.81
(strong correlation).
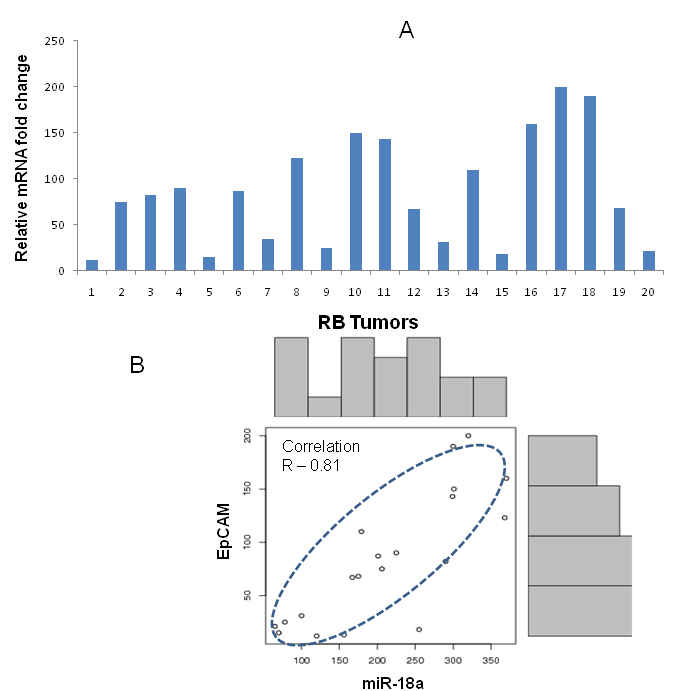
 Figure 2 of
Kandalam, Mol Vis 2012; 18:2279-2287.
Figure 2 of
Kandalam, Mol Vis 2012; 18:2279-2287.