Figure 3. VEGF/PEDF ratio in the control group and in high myopic patients. The 3 high myopia groups had a significantly lower VEGF/PEDF
ratio than the control group (p=0.000, 0.005, and 0.002; Mann–Whitney test). In particular, high myopic patients with posterior
staphyloma had a significantly lower VEGF/PEDF ratio than the high myopia with no complications group and high myopia with
chorioretinal atrophy group (p=0.050 and 0.036, respectively; Mann–Whitney test).
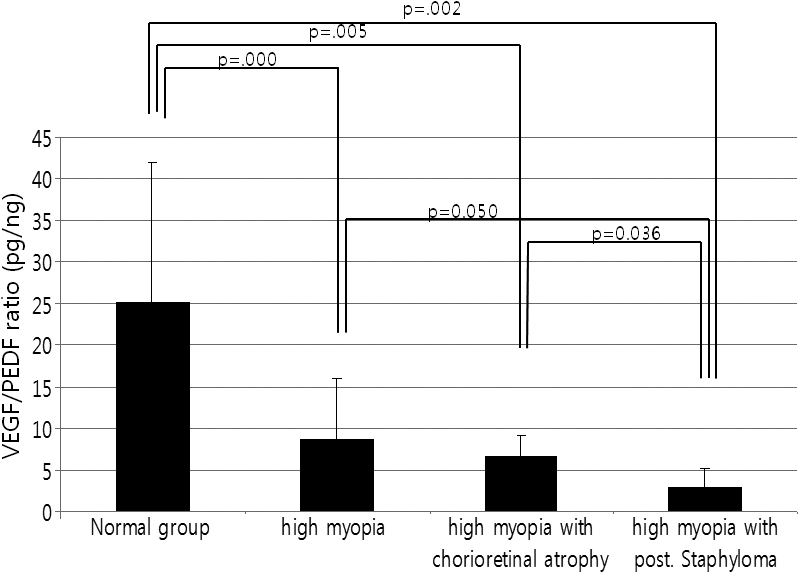
 Figure 3 of
Shin, Mol Vis 2012; 18:2265-2270.
Figure 3 of
Shin, Mol Vis 2012; 18:2265-2270.