Figure 6. The phenotypic
characterization of DCs treated with 50% CSC culture supernatant
in presence of neutralizing TGF-β2 antibody, measured
by flow cytometry. The expression of each surface molecule
(filled) compared to the respective isotype control (empty).
Representative example of three experiments.
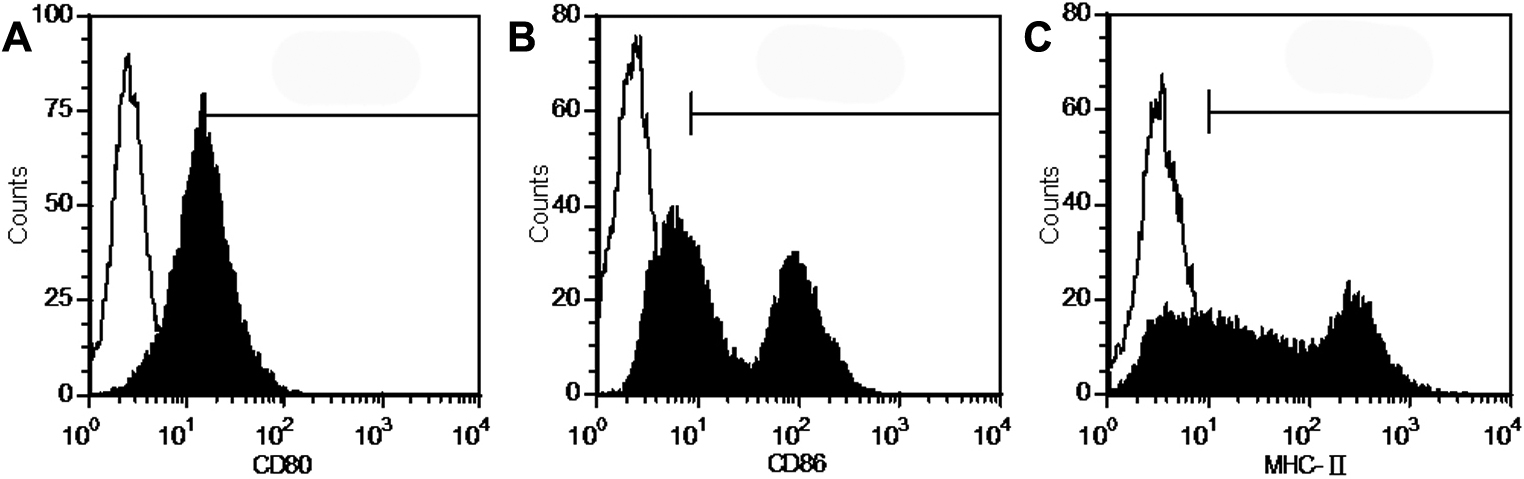
 Figure 6
of Lu, Mol Vis 2012; 18:2255-2264.
Figure 6
of Lu, Mol Vis 2012; 18:2255-2264.