Figure 2. The phenotypic characterization of cultured cells by flow cytometry analysis. Data demonstrated that T cells were positive
for CD3 (A), and DCs were positive for CD11c (B). Isotype control (open histogram) and stain with relevant antibody (filled histogram) are shown.
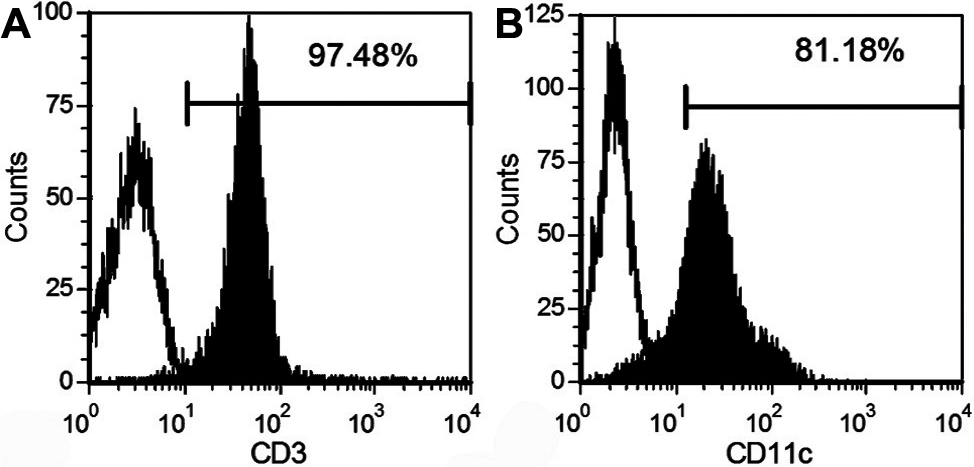
 Figure 2 of
Lu, Mol Vis 2012; 18:2255-2264.
Figure 2 of
Lu, Mol Vis 2012; 18:2255-2264.