Figure 5. Sequencing and RT–PCR
analysis of the cultured skin fibroblast mRNA. A:
Strategy for amplification of the COL4A5 cDNA by PCR.
Exons are represented by open rectangles and are numbered. The
localizations of the two amplified fragments are shown with the
primer binding sites (horizontal arrows). B: Sequencing
of the COL4A5 cDNA amplified by a pair of primers 1/1’
in III-1. The junctions of exons 45, 46, and intron 45 are shown
by the vertical lines, respectively. N: normal sequence. C:
Left; RT–PCR amplification of a 284 bp fragment of COL4A5
mRNA using a pair of primers 2/2’. M: DNA molecular mass marker;
Lane 1 to 4: PCR products of COL4A5 cDNA from III-1,
II-2 and two normal male controls, respectively. As compared
with the normal individuals, III-1 had a single larger sized
RT–PCR product that contained a 71- base- pair indel identified
in exon 45, whereas II-2 had two RT–PCR products: the normal
sequence and the mutant sequence. C: Right; Schematic
representation of the aberrant COL4A5 cDNA resulting
from the splice site mutation. Exons are represented by open
rectangles and are numbered, and intron 45 is indicated by the
horizontal line. D: Forward (Left) and reverse (Right)
sequencing of the COL4A5 cDNA amplified by a pair of
primers 2/2’ in II-2. The junctions of exons 45 and 46 are shown
by the vertical lines, respectively. N: normal sequence.
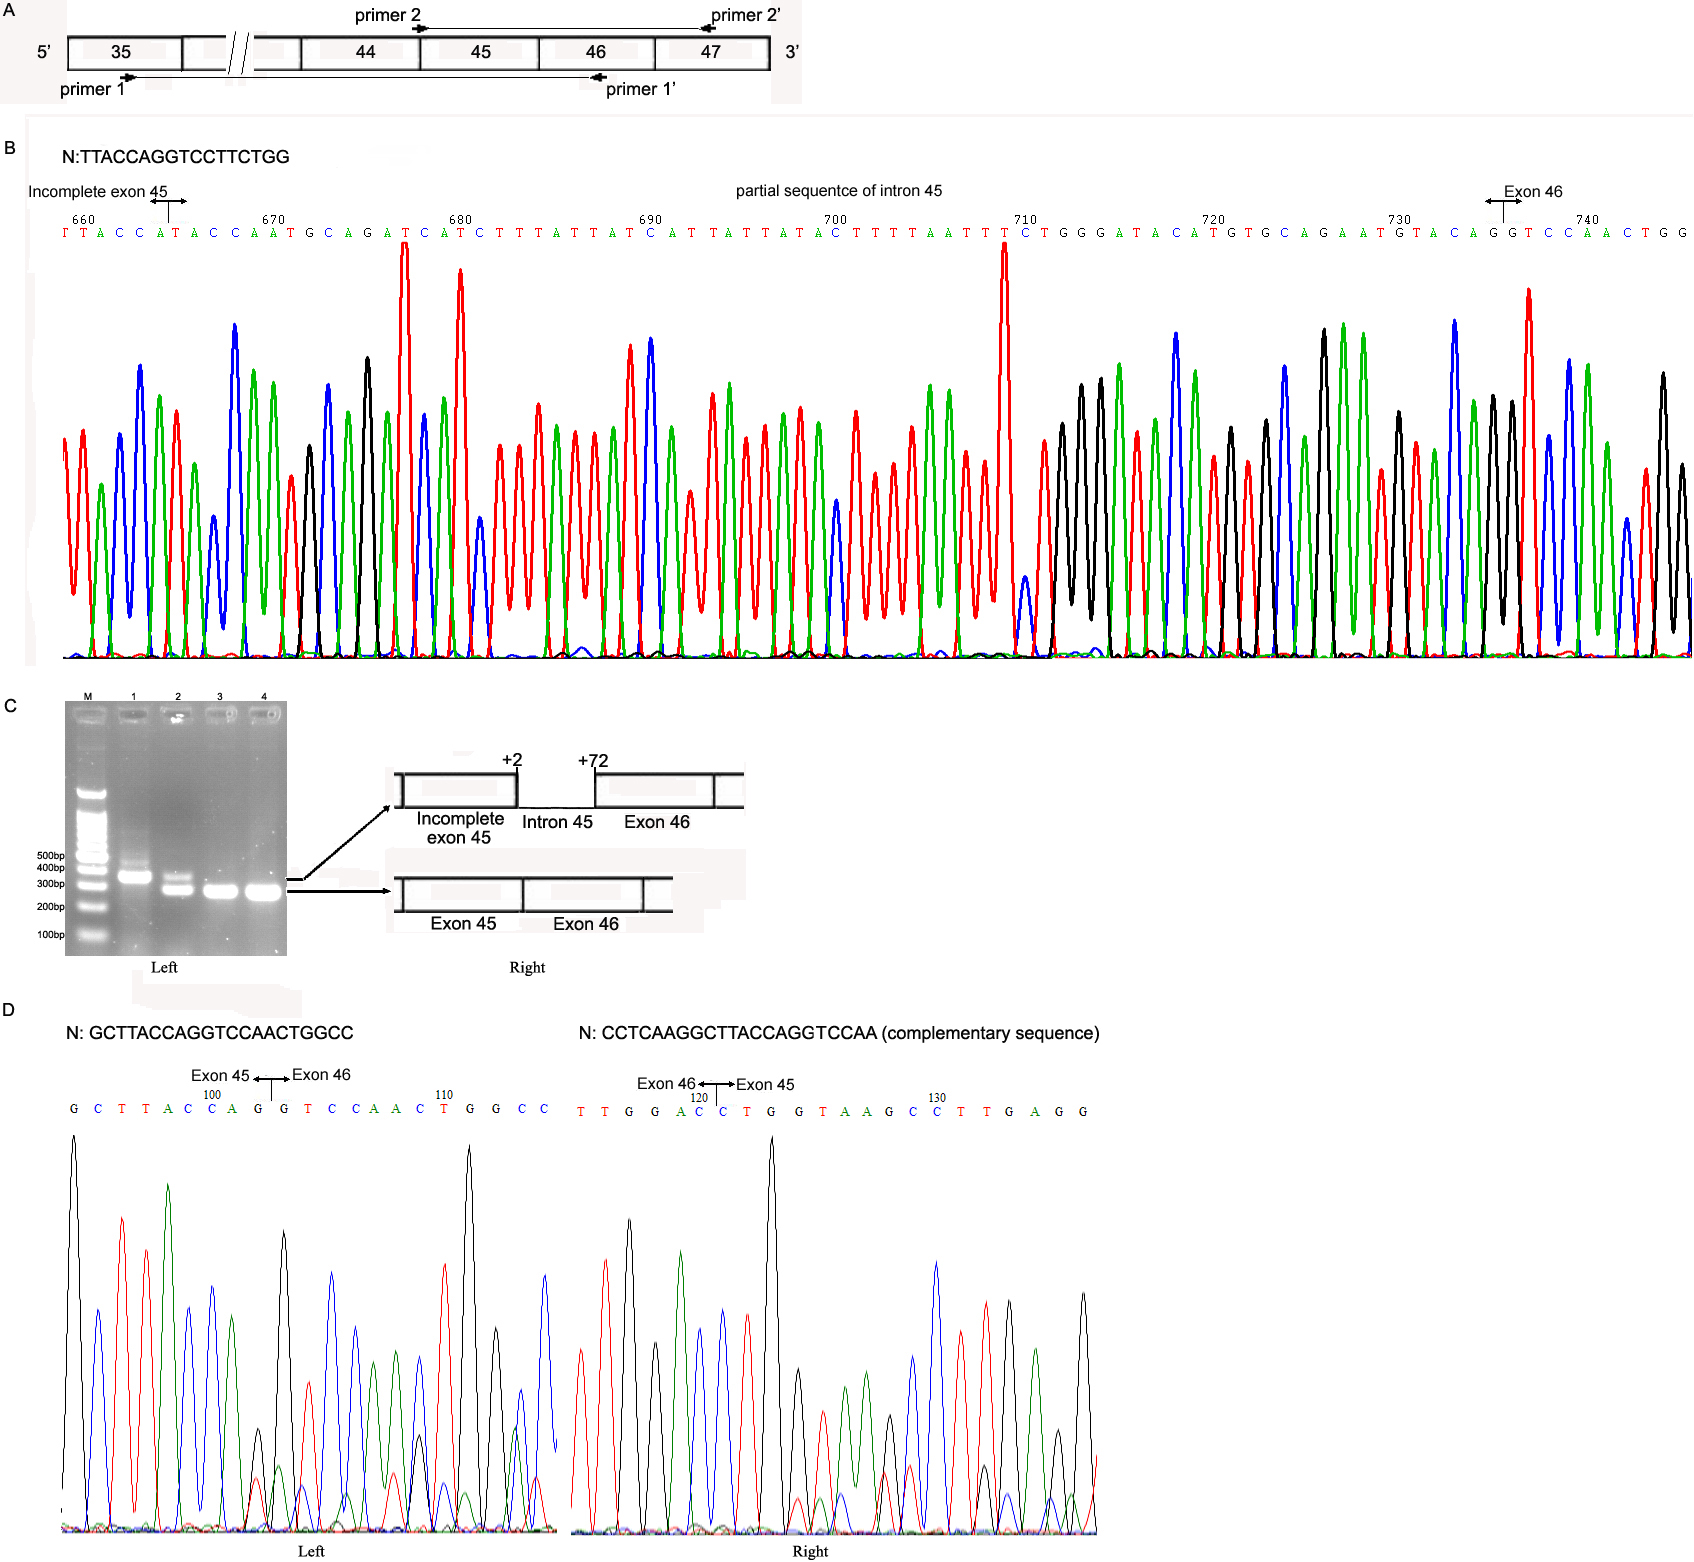
 Figure 5
of Zhao, Mol Vis 2012; 18:2205-2212.
Figure 5
of Zhao, Mol Vis 2012; 18:2205-2212.