Figure 4. IVCM images and IVCM scale
analyses. HRT II IVCM images of rabbit ocular surface 4 h after
the repeated instillations of PBS (column 1), CsA-CEm (column
2), CsA-AEm (column 3), CsA-oil (column 4), and 0.02%BAK (column
5). Results are shown for the superficial epithelium (line 1),
basal epithelium (line 2: 10–15 μm from the superficial
epithelium layer), limbus (line 3: 10–30 μm from the superficial
epithelium layer), and CALT (line 4: 0–15 μm from dome layer).
U: IVCM score, and V: inflammatory cell counts in the CALT for
the different treatments. BAK 0.02%-treated eyes presented the
greatest damage (superficial epithelium disorganization and
significant inflammatory cell infiltration in both basal
epithelium and limbus). Extremely heavy infiltration of
inflammatory cells inside and outside the CALT structure can
also be observed. The three CsA formulations induced some
inflammatory cell infiltration mainly around the CALT structure
without alteration of the corneal structure. (Images: 400 µm×400
µm). Note the similarity of P, Q, R, and S.* p≤0.03 compared to
PBS and p<0.0001 compared to 0.02%BAK. # p<0.05 compared
to CsA-AEm.
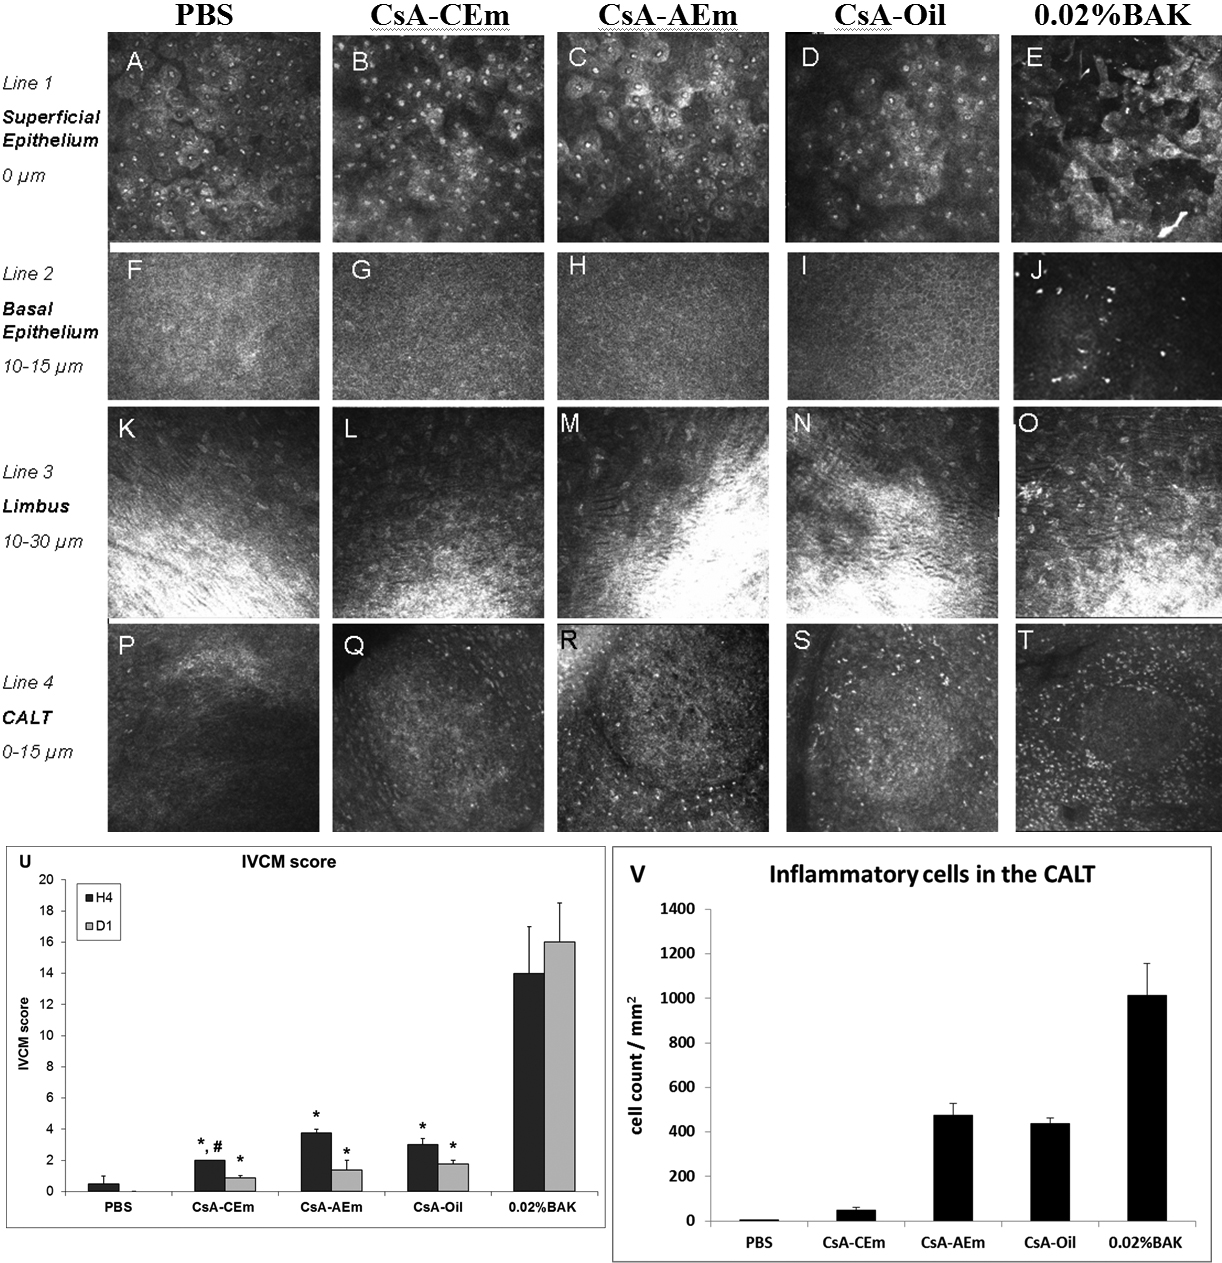
 Figure 4
of Liang, Mol Vis 2012; 18:2195-2204.
Figure 4
of Liang, Mol Vis 2012; 18:2195-2204.