Figure 3. DNA sequence chromatograms and cosegregation analysis of the p.N188I mutation with disease phenotype. A: Heterozygote sequence (sense strand) shows an A/T transition in codon 188 that changed asparagine (AAC) to isoleucine (ATC).
B: A difference plot of the eight members in this family by high-resolution melt curve analysis (HRM) for the mutation p.N188I.
The median green, straight line presents the normal control line. The real-time PCR products of the family members are compared
to the median normal control to produce the plot. The curve revealed that the mutant pattern (red ring pointed) co-segregated
with the affected individuals, but not with the unaffected individuals (black ring pointed).
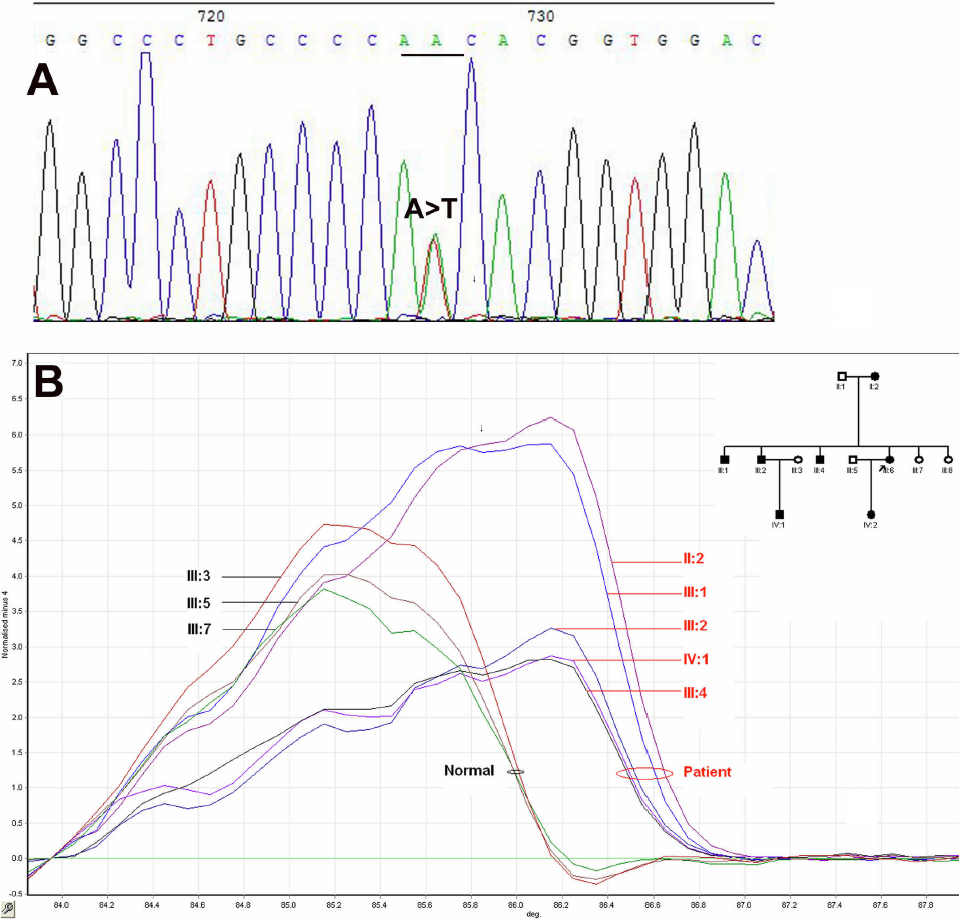
 Figure 3 of
Zhang, Mol Vis 2012; 18:203-210.
Figure 3 of
Zhang, Mol Vis 2012; 18:203-210.