Figure 4. Imaging of apoptosis of the
LECs. The round apoptosis area could be readily distinguished
after 30 min (A–C). Apoptotic cells showed green
fluorescence (YO-PRO®-1; D), and dead cells
showed primarily red fluorescence (PI; E, J).
Blue-fluorescent Hoechst 33342 stained the condensed chromatin
of apoptotic cells and the normal chromatin of live cells (F,
K). C: A merging of D, E, and F.
B: A merging of A and C. After 30 min,
the cell borders and small, rounded humps were clearly observed
(G). After five h, the nuclei of the apoptotic cells
moved aside, and round caves were left in the original sites (H).
After 20 h, the nuclei were invisible under an optical
microscope, and there were only round caves in the irradiation
area (I). Fluorescent staining showed that all of the
cells were dead, and the nuclei lay adjacent to the round caves
(J–L). L: A merging of I, J,
and K. High-magnification images of the apoptotic cells
are shown in the rectangles. Scale bars: A–L=50
μm.
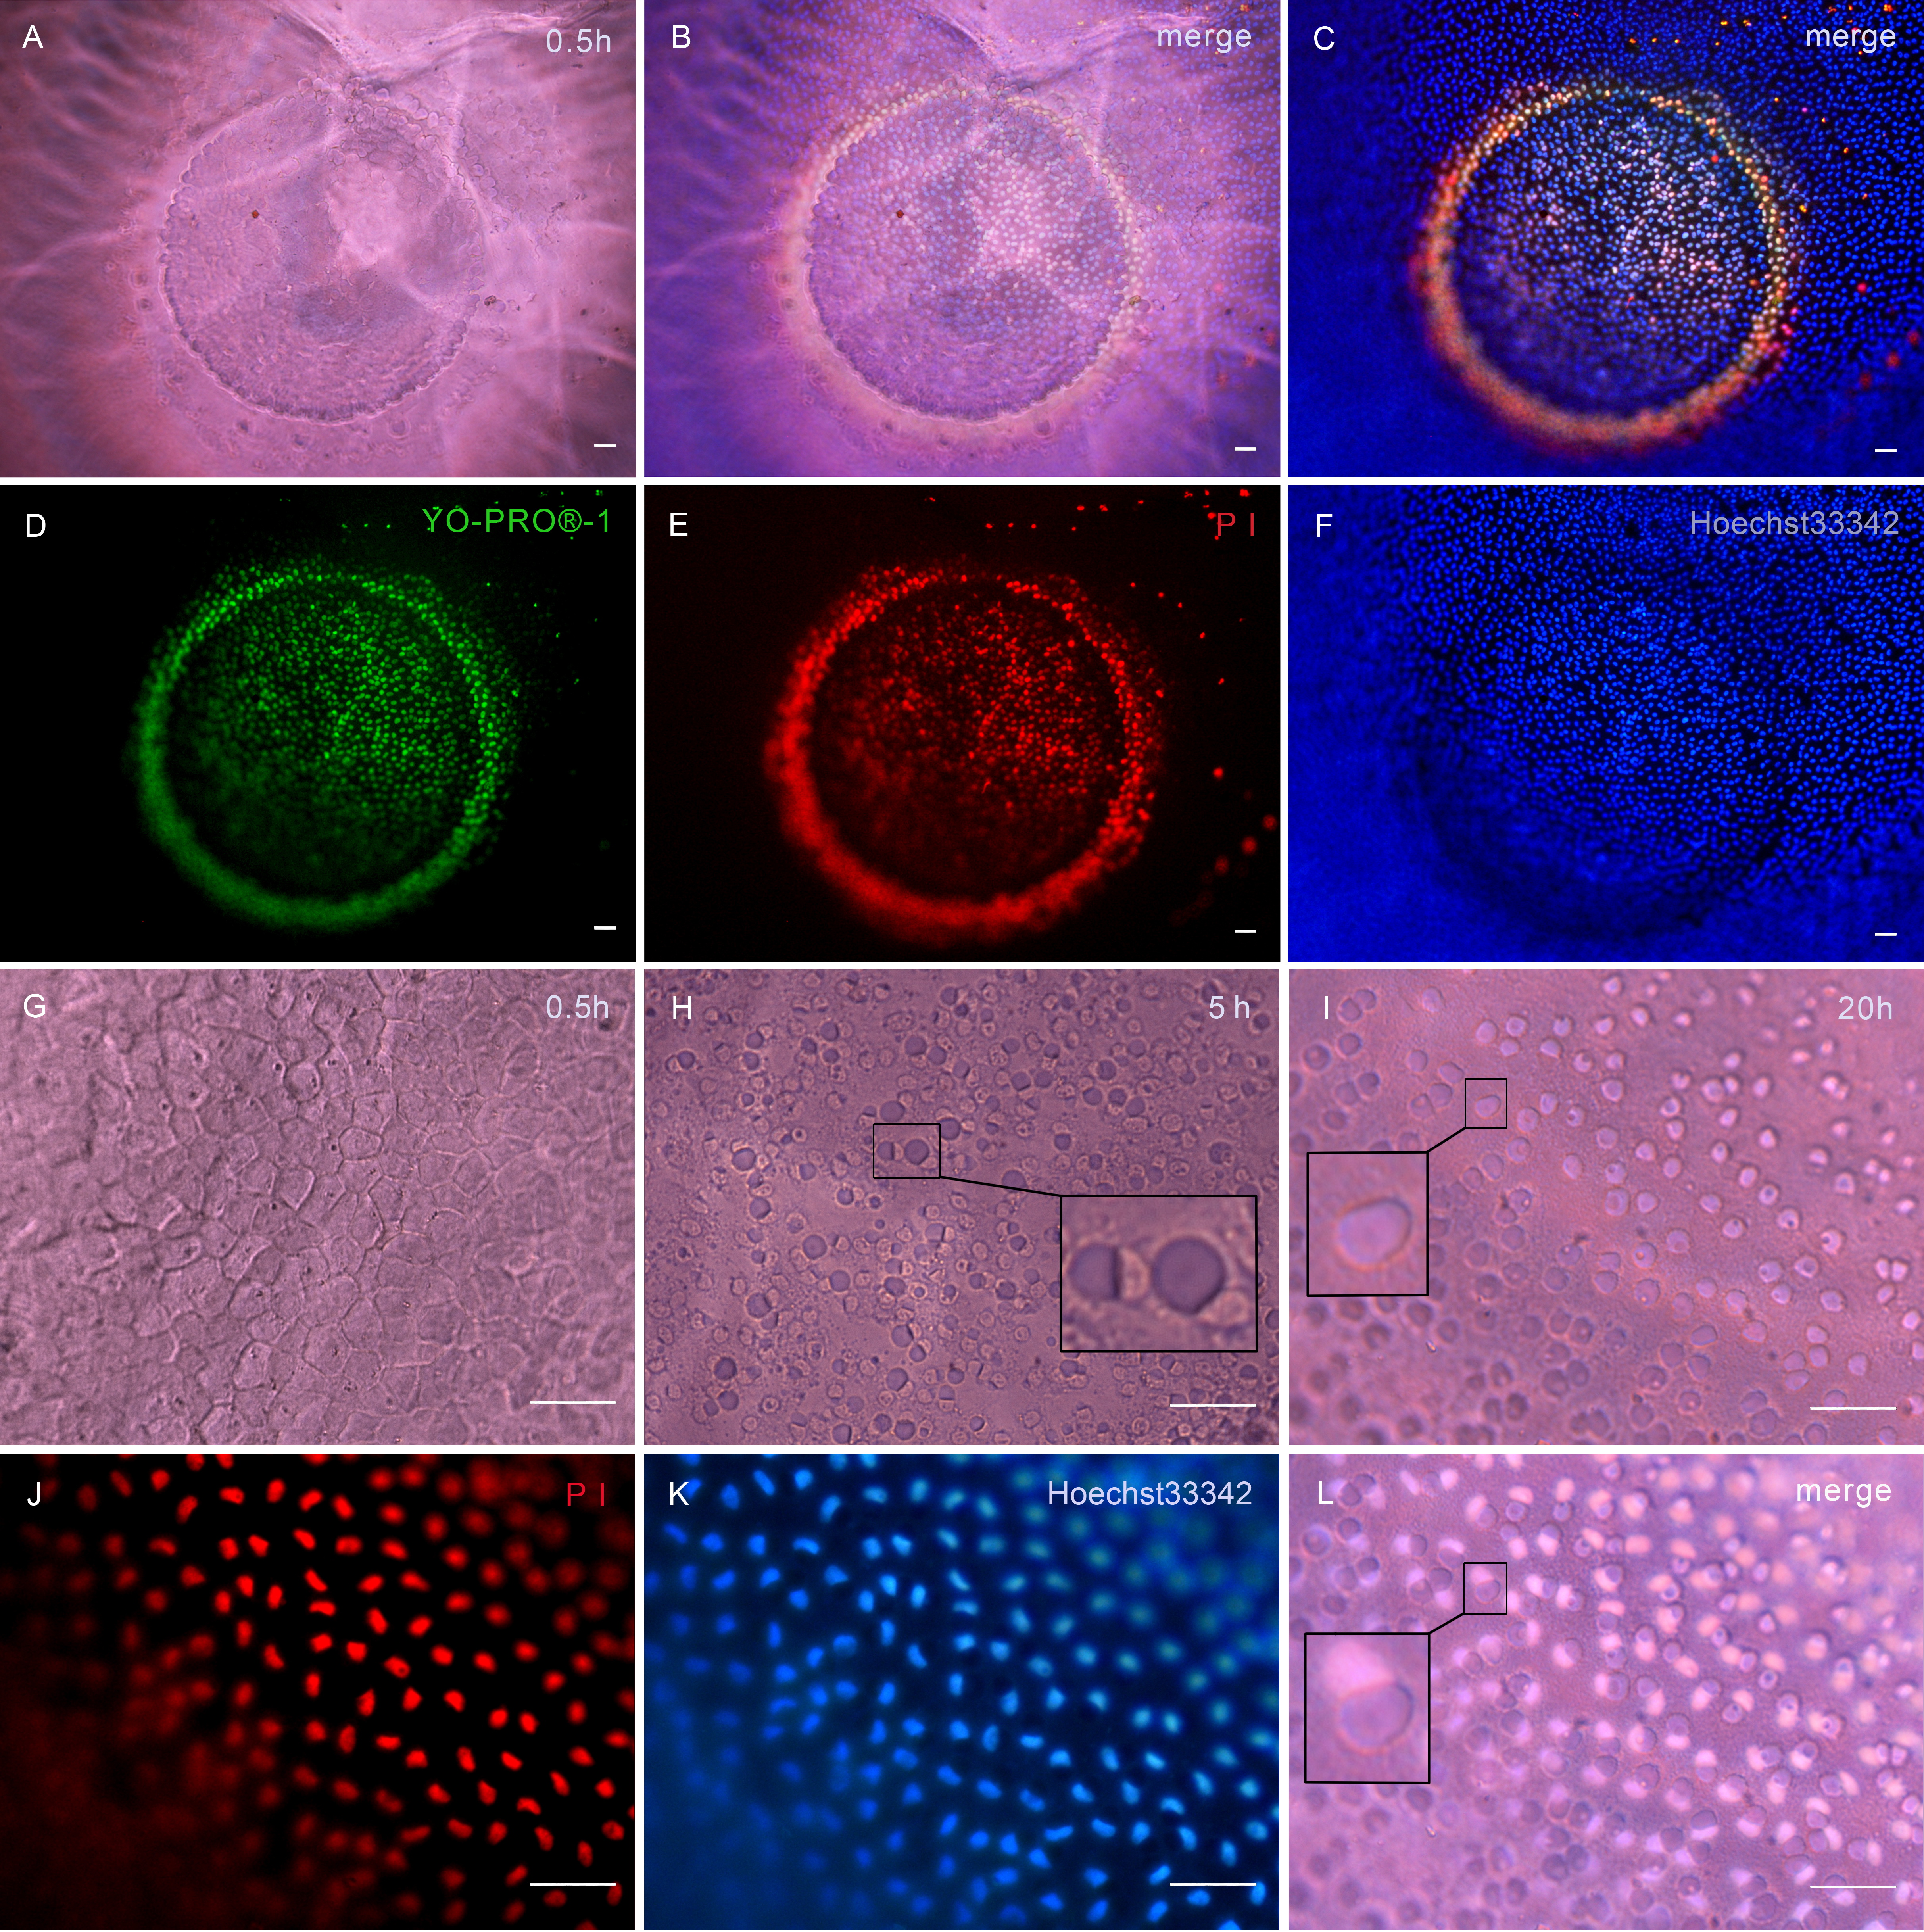
 Figure 4
of Kong, Mol Vis 2012; 18:2165-2173.
Figure 4
of Kong, Mol Vis 2012; 18:2165-2173.