Figure 4. Comparison of cell number
in control and optic nerve crush (ONC) retinas. The graph shows
the average cell count of BALB/cByJ using TO-PRO-3 labeling. The
control group has an average of 8,750 cells/mm2 with
a standard error of 359; the ONC group has an average of 3,901
cells/mm2 with a standard error of 496. This
illustrates a significant loss of retinal ganglion cells
(p<0.01).
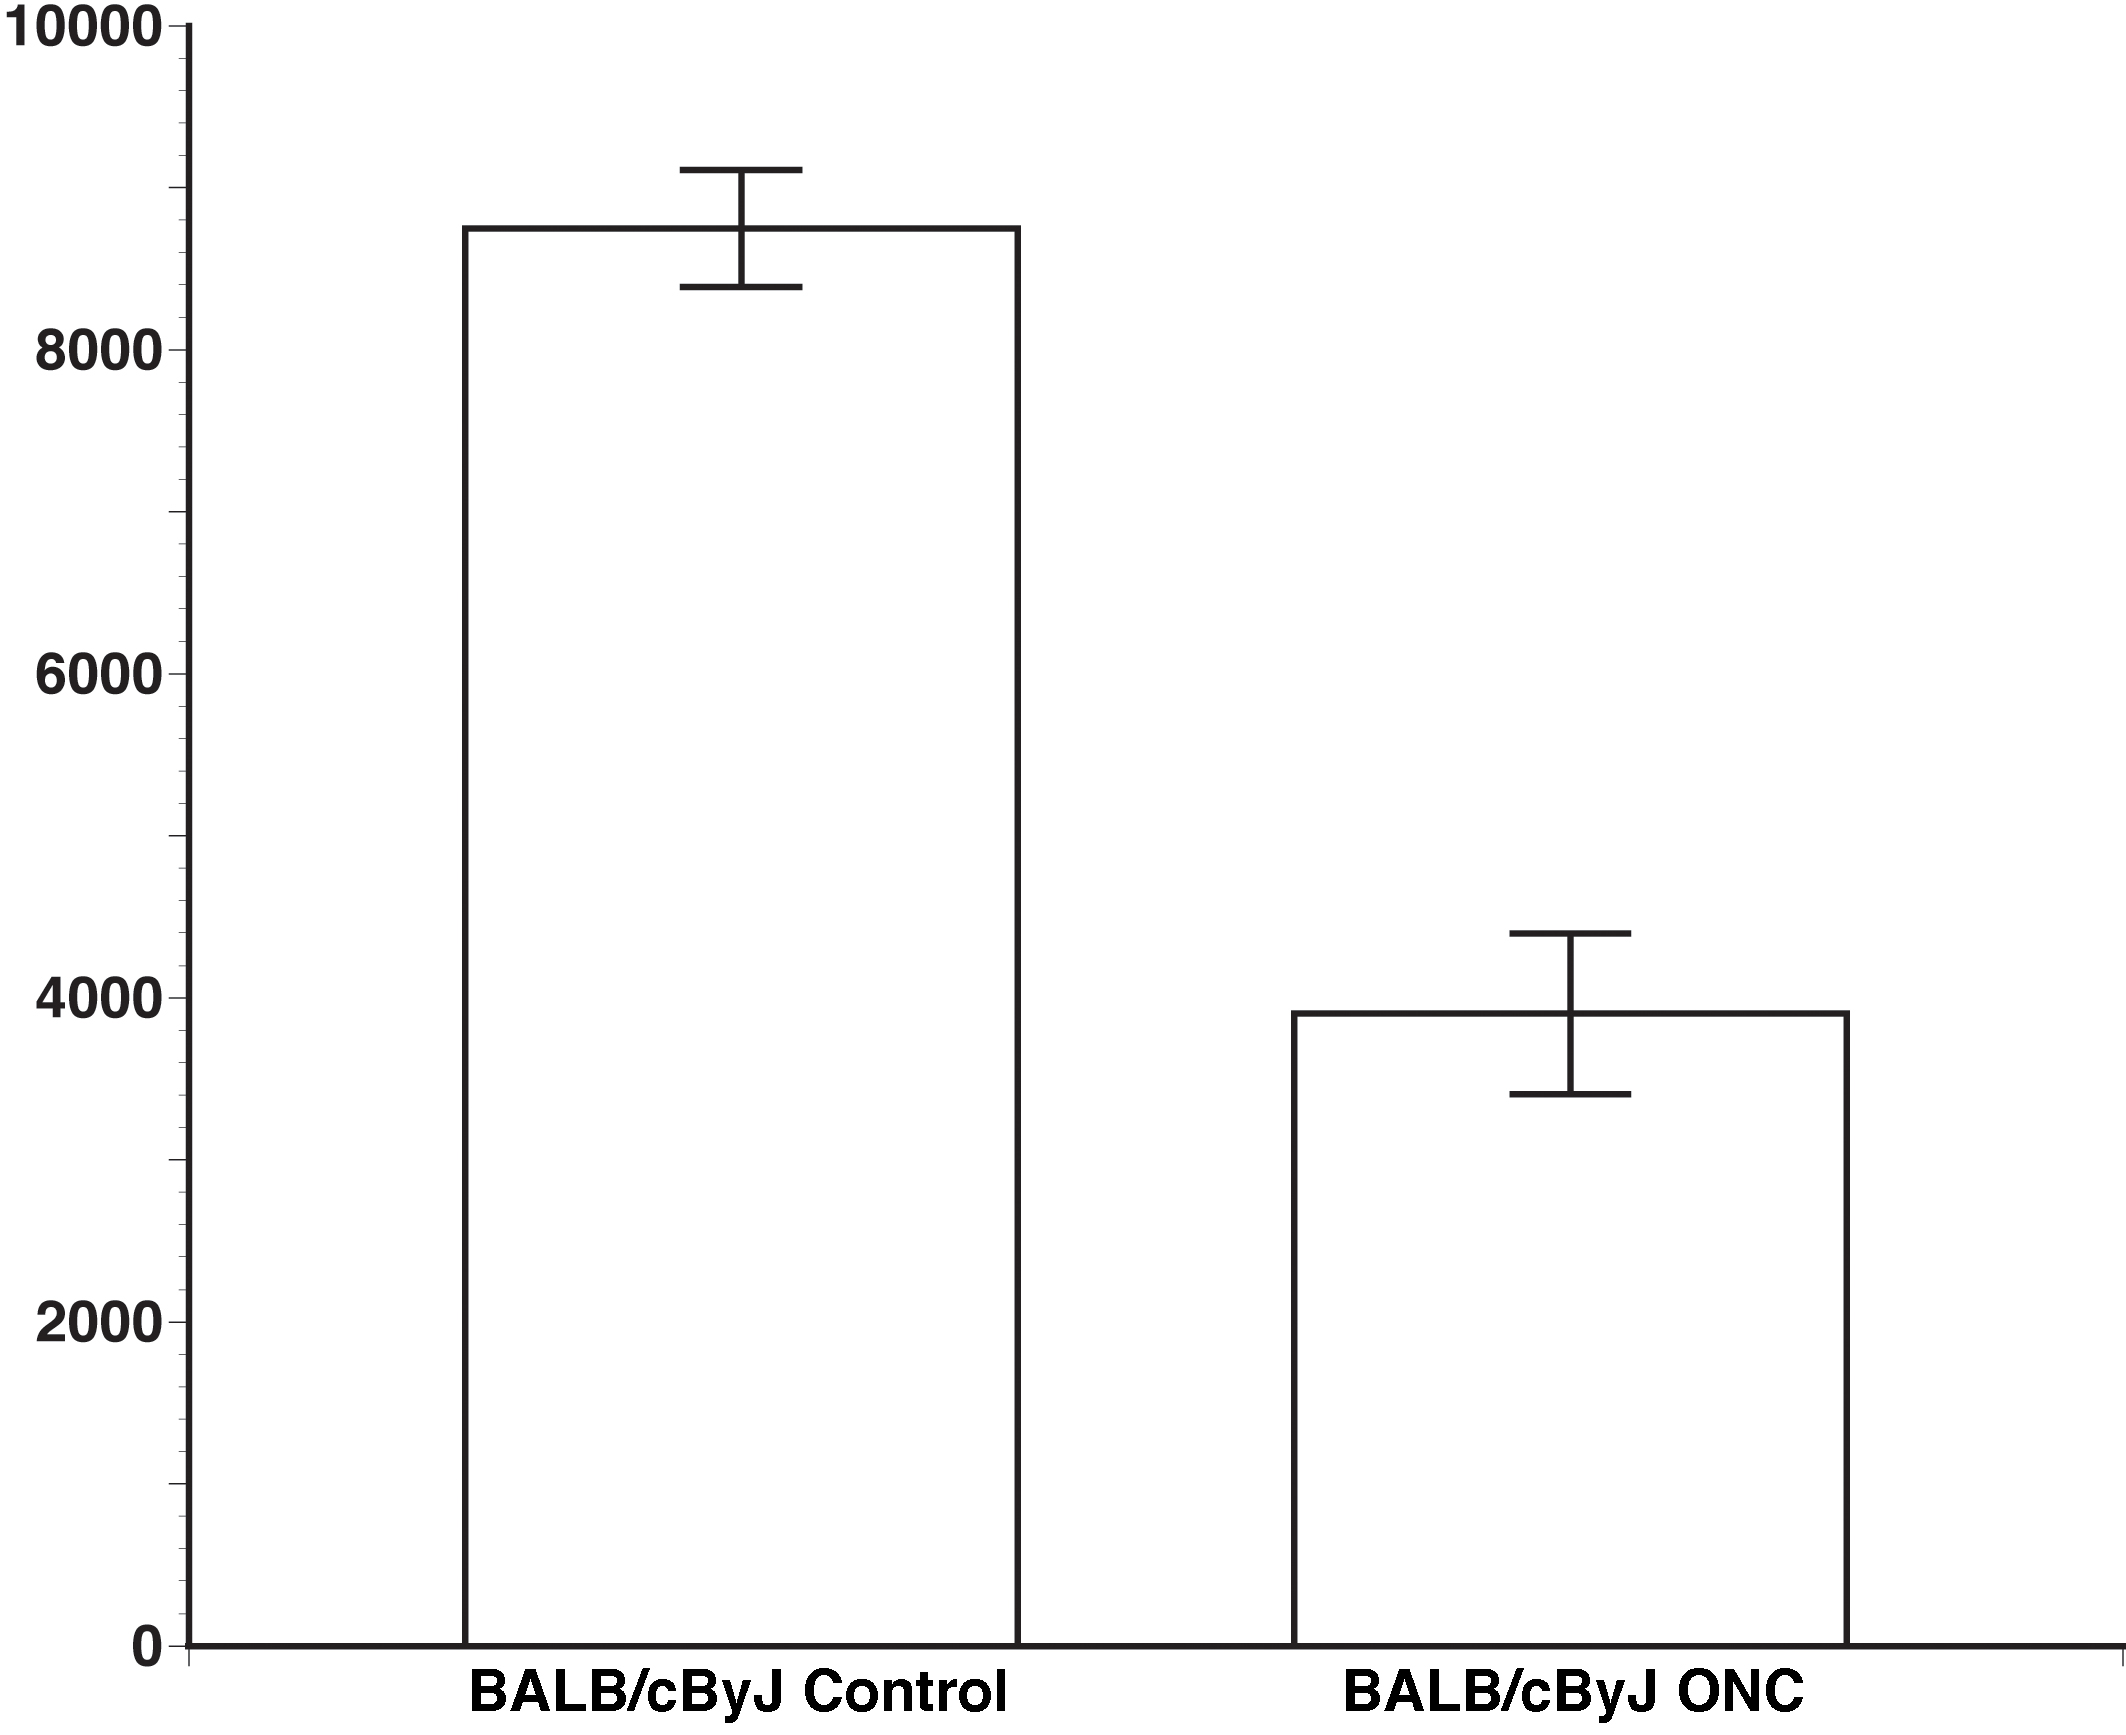
 Figure 4
of Templeton, Mol Vis 2012; 18:2147-2152.
Figure 4
of Templeton, Mol Vis 2012; 18:2147-2152.