Figure 3. Example of TO-PRO-3 images
in BALB/cByJ control and optic nerve crush (ONC) retinas. Panel
A and panel B demonstrate the TO-PRO-3 staining
in the BALB/cByJ control and ONC retina, respectively. Only the
RGC layer cells that were not obviously endothelial cells were
counted. There were four individual retinas with approximately
12 fields each, totaling 48 counted fields per control and ONC
group. The scale bar is 50 µm.
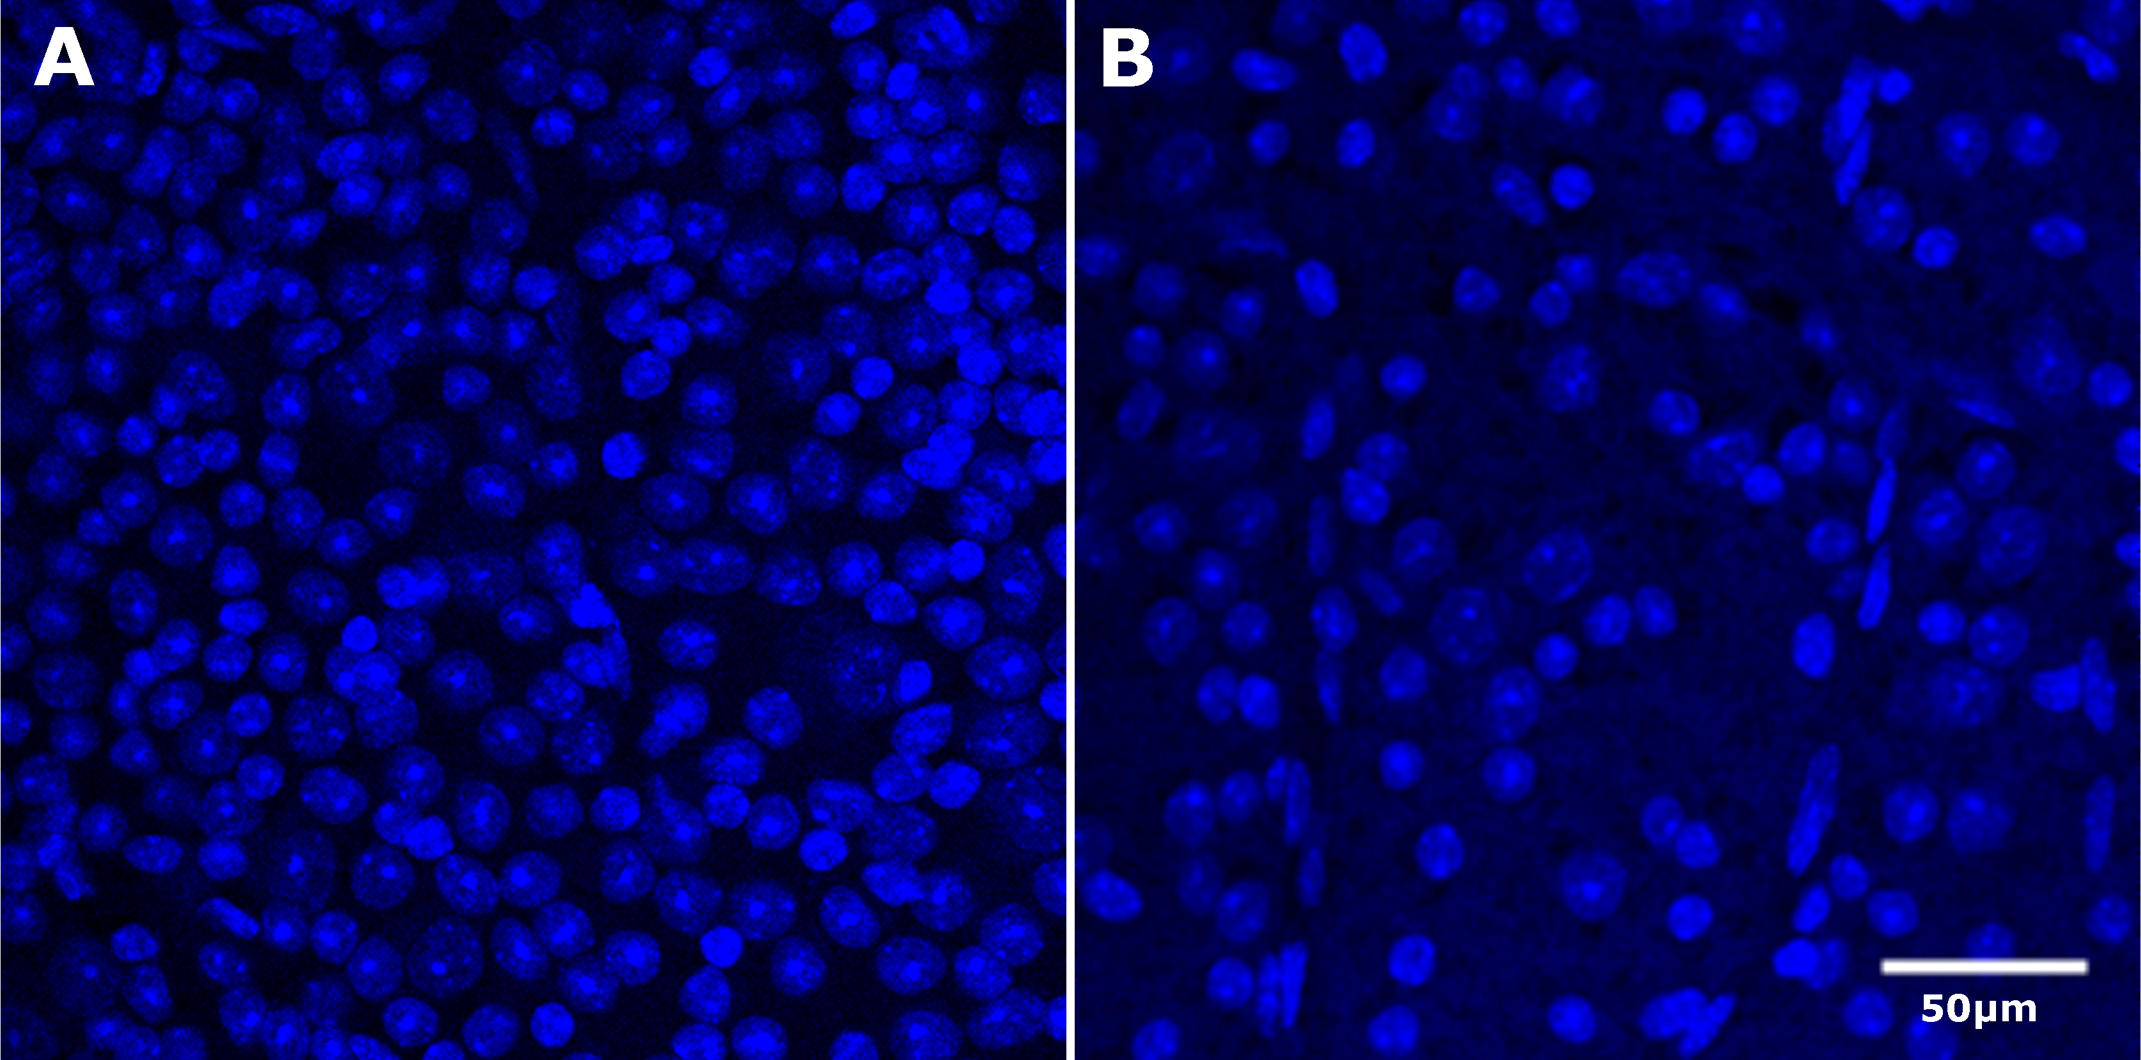
 Figure 3
of Templeton, Mol Vis 2012; 18:2147-2152.
Figure 3
of Templeton, Mol Vis 2012; 18:2147-2152.